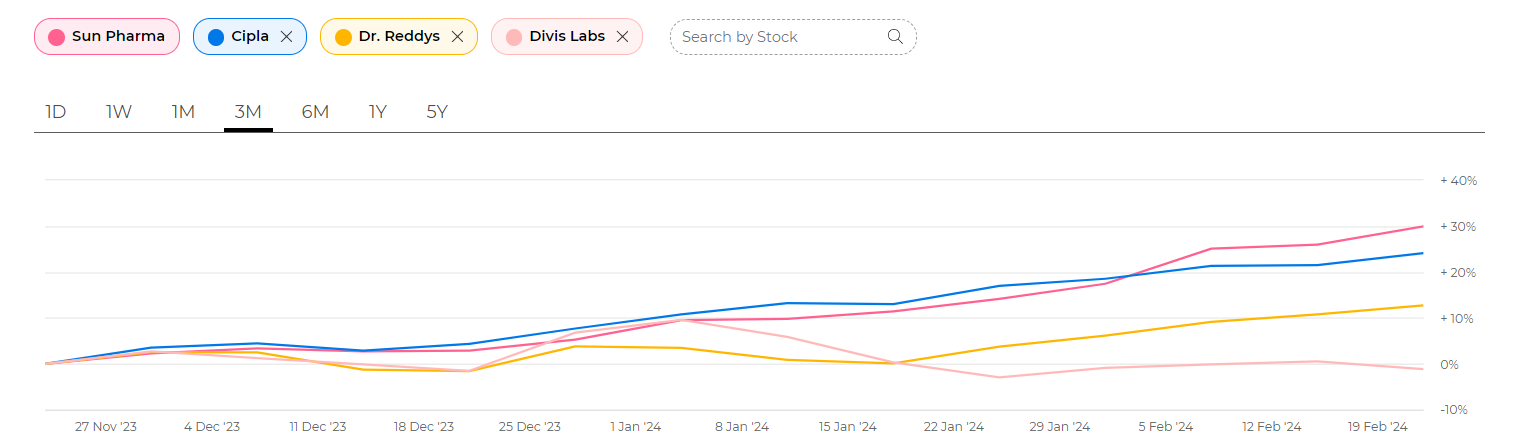
Sun Pharma Alpha chart

Sun Pharmaceutical Industries Stock Blog, your one-stop destination for real-time information and analysis of a leading stock. Explore the latest updates on Sun Pharmaceutical Industries stock, including: Last traded price 1563.65, Market capitalization: 375052.05, Volume: 265821, Price-to-earnings ratio 42.16, Earnings per share 37.12. Our blog combines fundamental and technical insights to offer a comprehensive overview of Sun Pharmaceutical Industries’s performance. Gain valuable market knowledge and make informed decisions with our expert analysis. Be the first to know about breaking news that can impact Sun Pharmaceutical Industries’s trajectory. Join us on this journey as we explore the exciting potential of Sun Pharmaceutical Industries. The data points are updated as on 23-02-2024
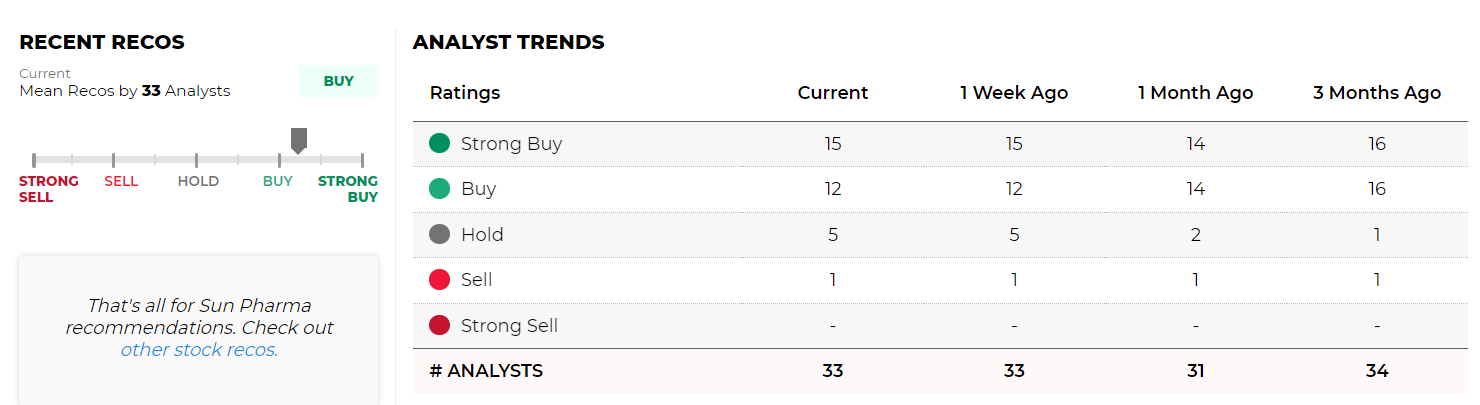
Sun Pharma Share Recommendations
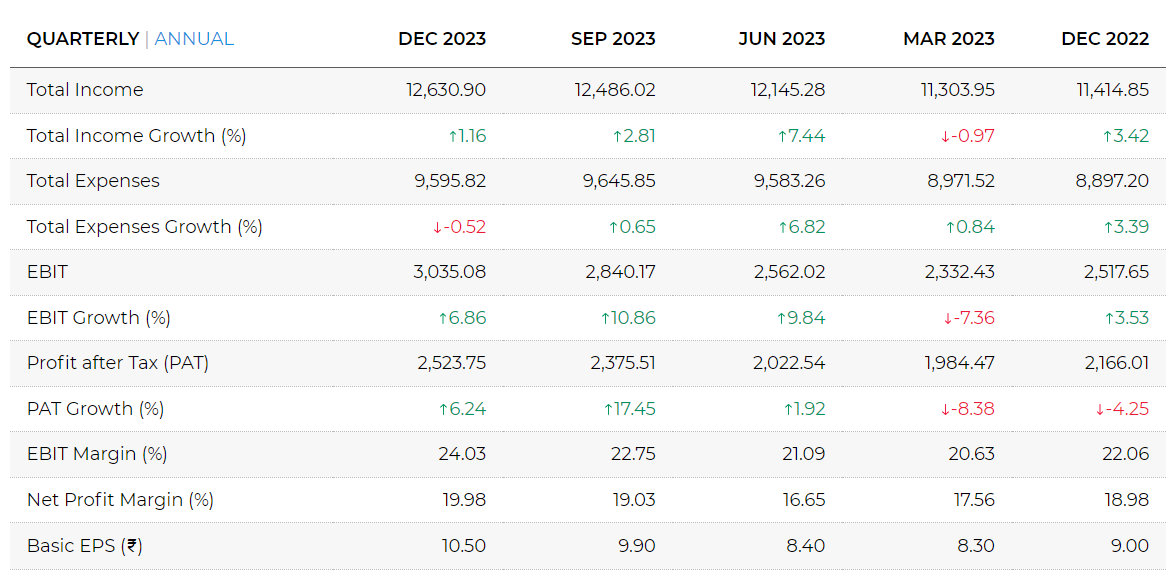
Sun Pharma Financials
Income (P&L)
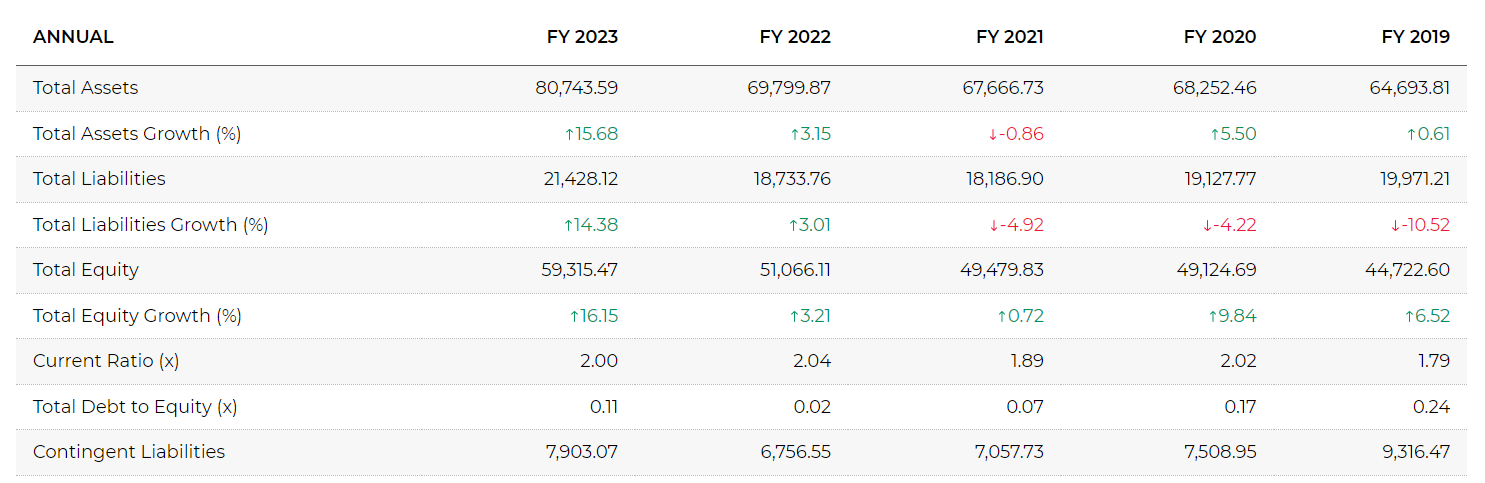
Balance Sheet
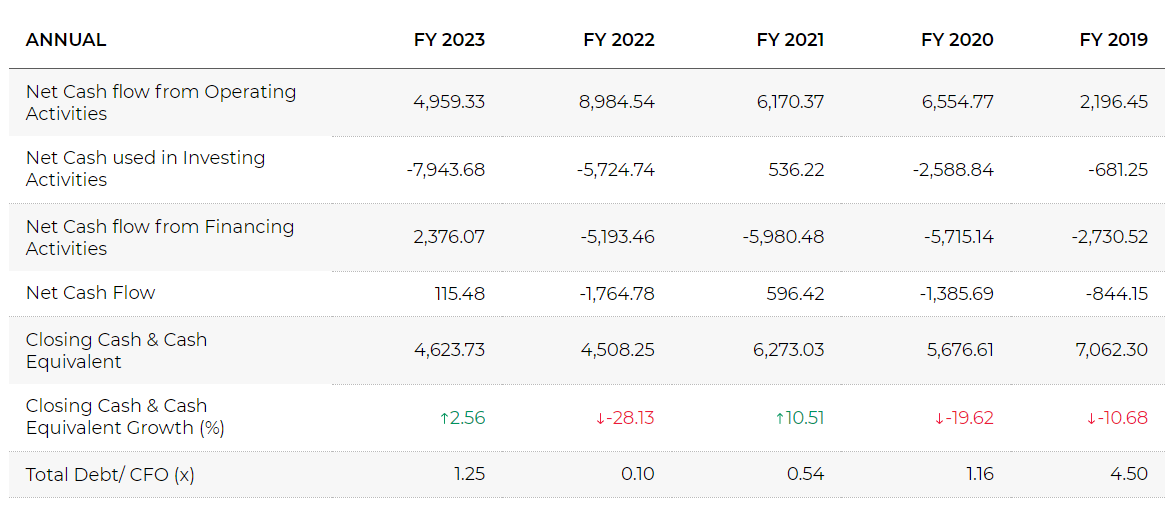
Cash Flow
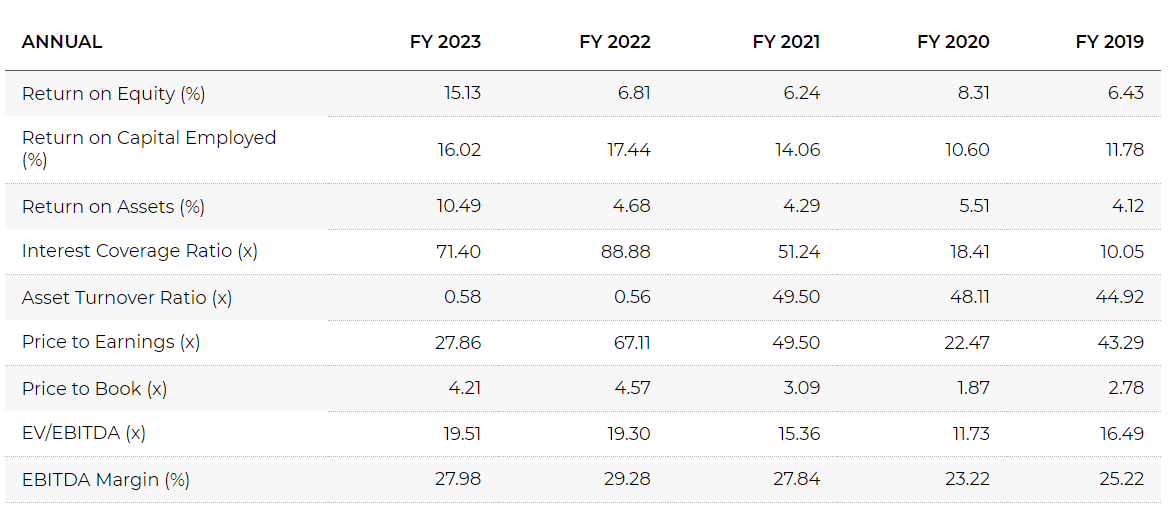
Ratios
Sun Pharma Technicals
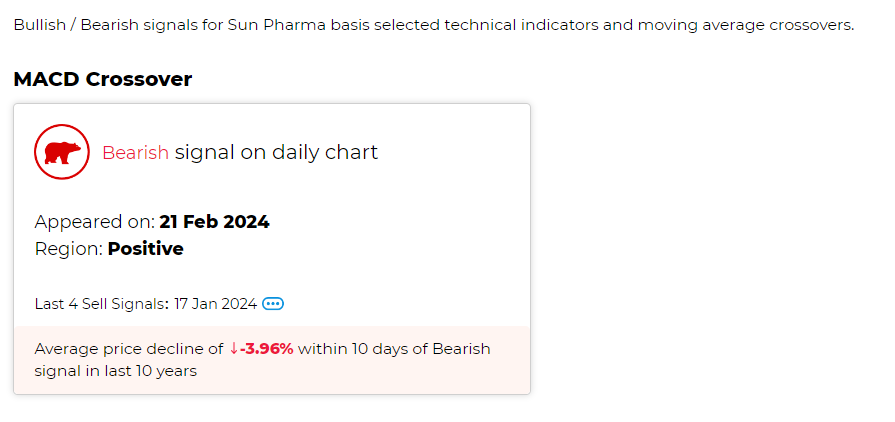
Buy / Sell Signals
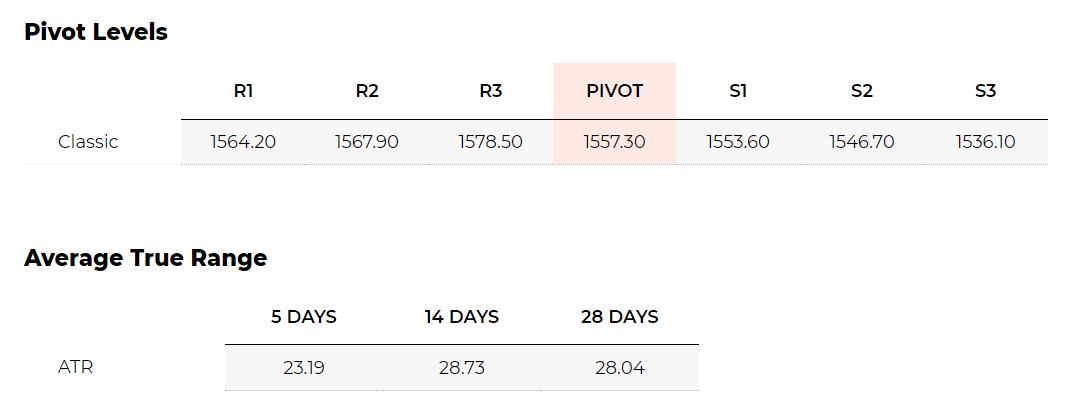
Pivot Levels & Average True Range
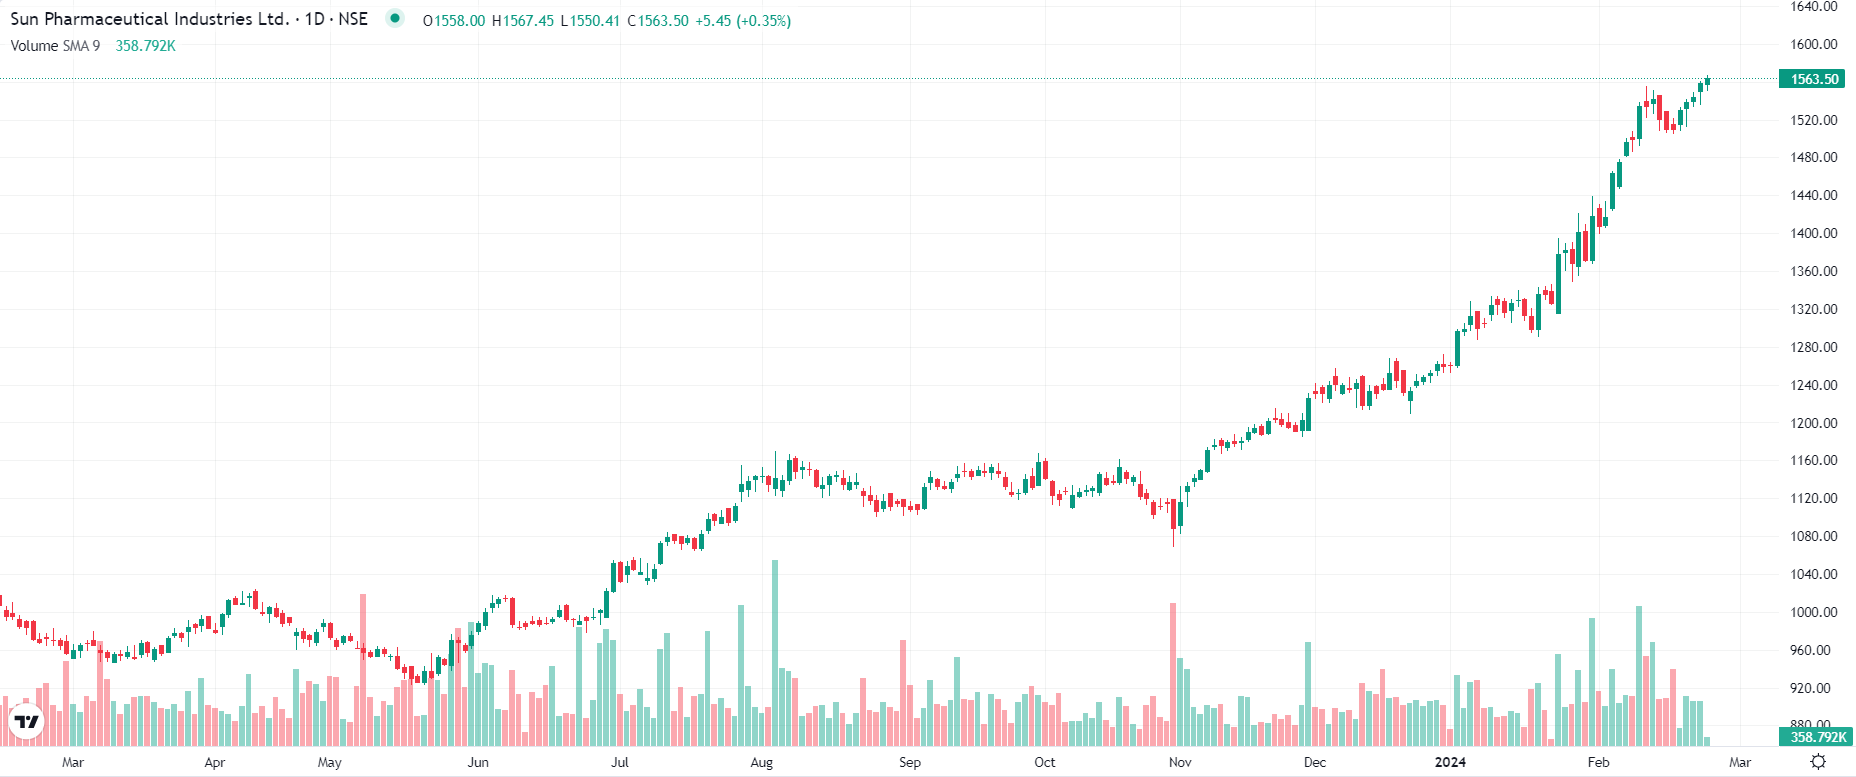
Chart
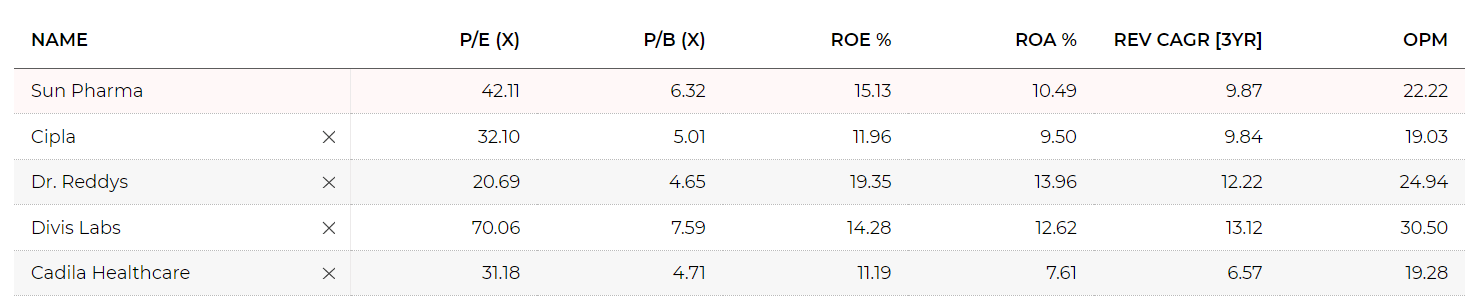
Sun Pharma Peer Comparison
STOCK PERFORMANCE
RATIO PERFORMANCE
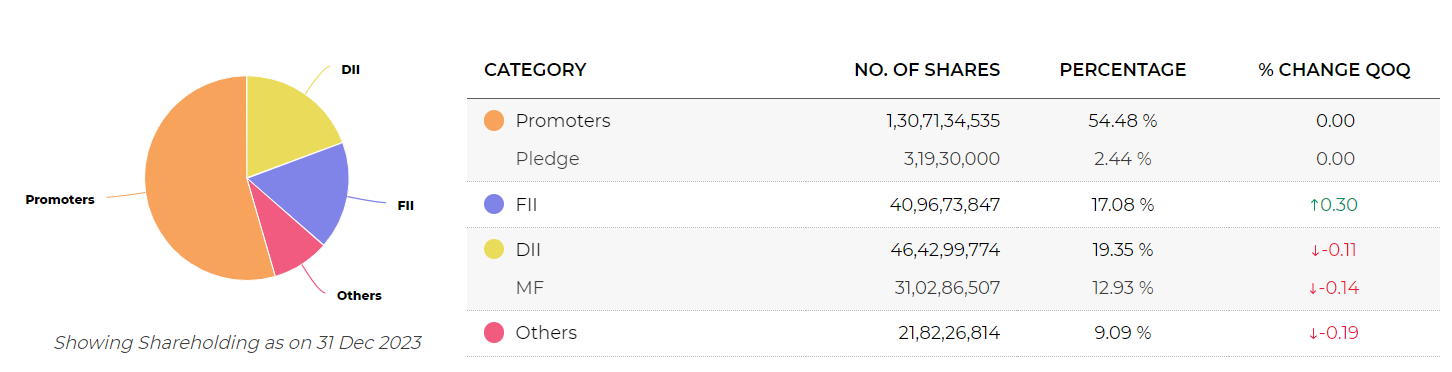
Sun Pharma Shareholding Pattern
QOQ Change

Total Shareholding
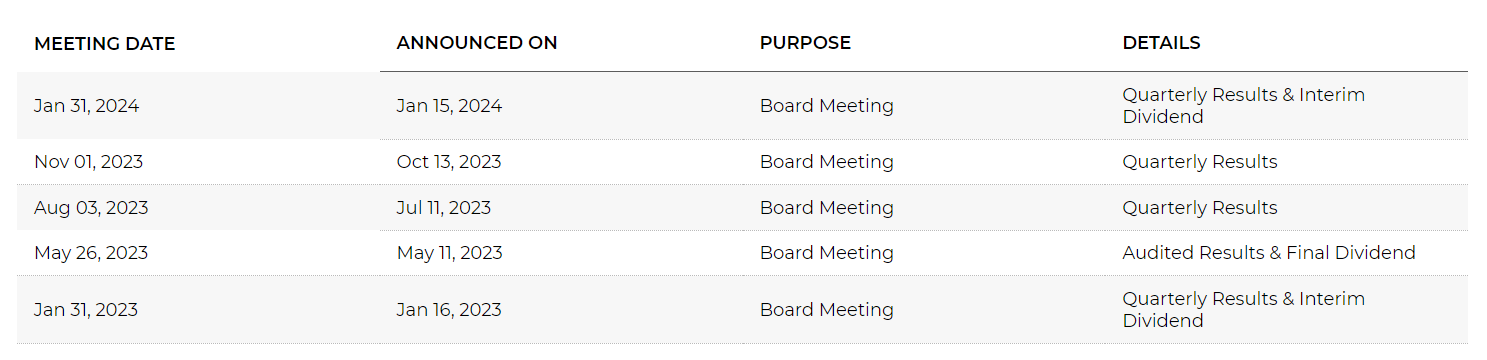
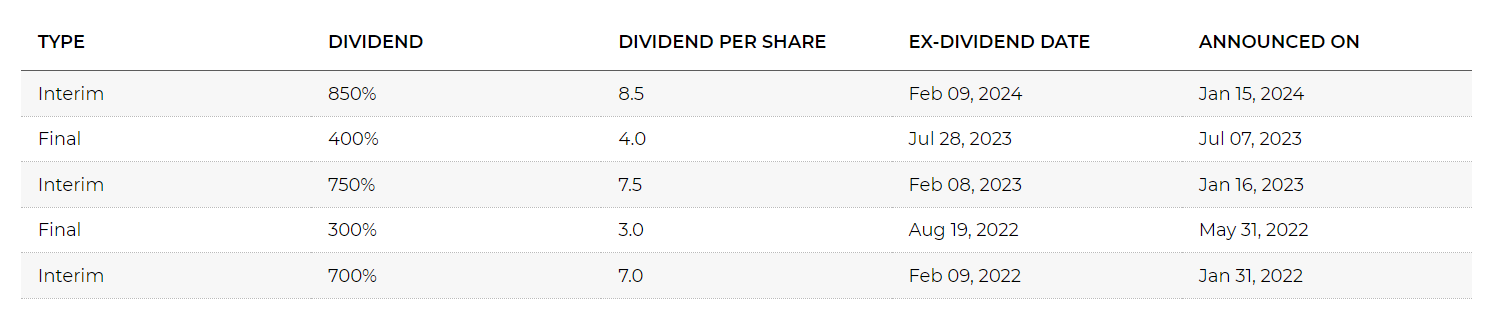
Sun Pharma Corporate Actions
BOARD MEETING/AGM
DIVIDENDS
About Sun Pharma
Sun Pharmaceutical Industries Ltd., incorporated in the year 1993, is a Large Cap company (having a market cap of Rs 373,828.39 Crore) operating in Pharmaceuticals sector.
Sun Pharmaceutical Industries Ltd. key Products/Revenue Segments include Pharmaceuticals and Other Operating Revenue for the year ending 31-Mar-2023.
For the quarter ended 31-12-2023, the company has reported a Consolidated Total Income of Rs 12,630.90 Crore, up 1.16 % from last quarter Total Income of Rs 12,486.02 Crore and up 10.65 % from last year same quarter Total Income of Rs 11,414.85 Crore. Company has reported net profit after tax of Rs 2,568.03 Crore in latest quarter.
The company’s top management includes Mr.Dilip S Shanghvi, Mr.Abhay Gandhi, Mr.Kirti Ganorkar, Mr.S Damodharan, Dr.Uday Baldota, Mr.Aalok D Shanghvi, Mr.Sailesh T Desai, Mr.Sudhir V Valia, Mr.Gautam Doshi, Dr.Pawan Goenka, Mr.Rama Bijapurkar, Mr.Rolf Hoffmann, Mr.Sanjay Asher, Mr.C S Muralidharan, Mr.Anoop Deshpande. Company has S R B C & Co. LLP as its auditors. As on 31-12-2023, the company has a total of 239.93 Crore shares outstanding.