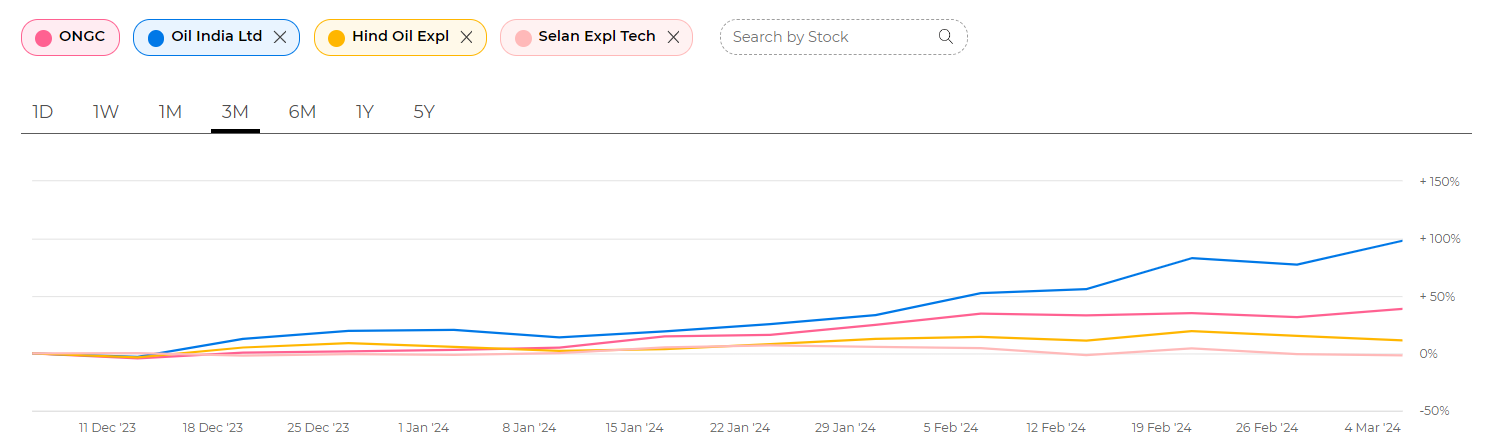
ONGC Alpha chart
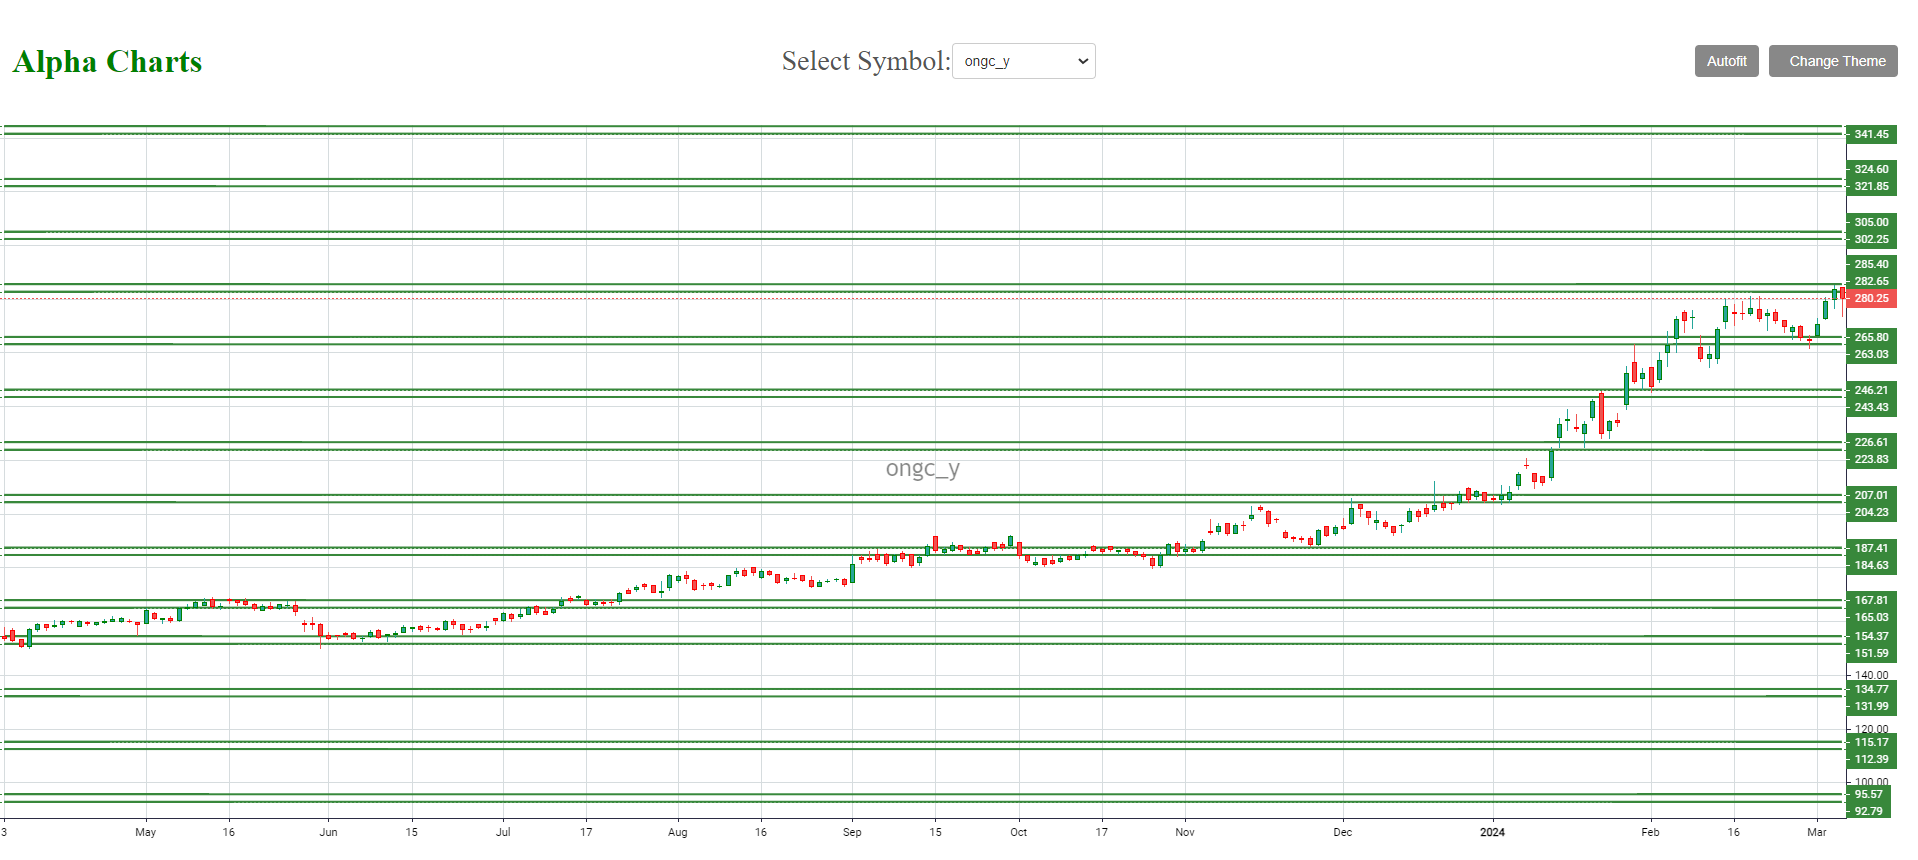
Oil And Natural Gas Corporation Stock Blog, your hub for real-time updates and comprehensive analysis on a prominent stock. Stay in the know with the latest information about Oil And Natural Gas Corporation, including: Last traded price 280.25, Market capitalization: 352562.32, Volume: 20181, Price-to-earnings ratio 8.41, Earnings per share 33.34. Our blog provides a well-rounded view of Oil And Natural Gas Corporation by incorporating both fundamental and technical indicators. Be the first to receive breaking news that can impact Oil And Natural Gas Corporation’s performance in the market. Our expert analysis and recommendations empower you to make informed investment choices. Stay informed and stay ahead with the Oil And Natural Gas Corporation Stock Liveblog. The data points are updated as on 07-03-2024
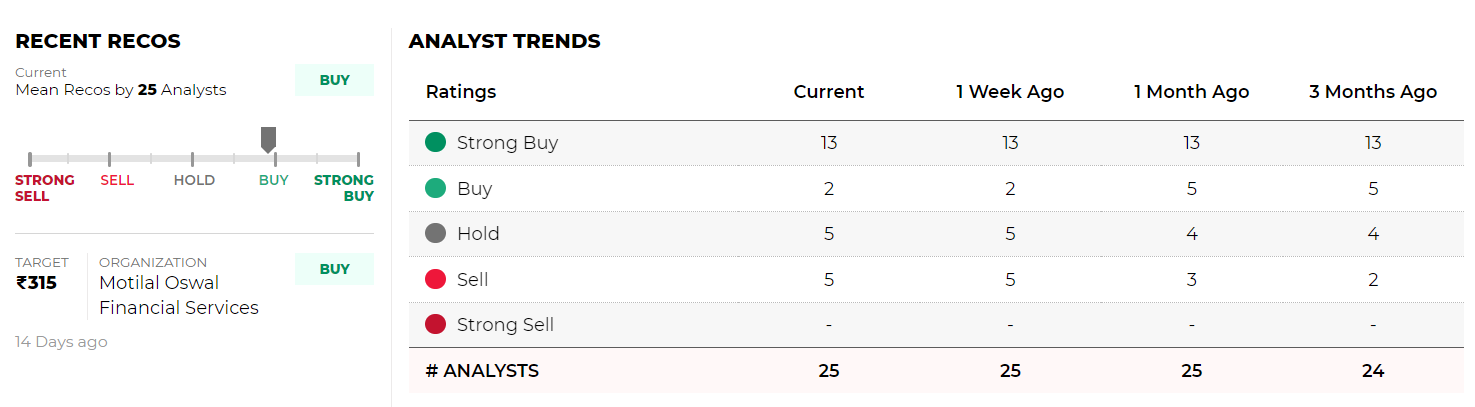
ONGC Share Recommendations
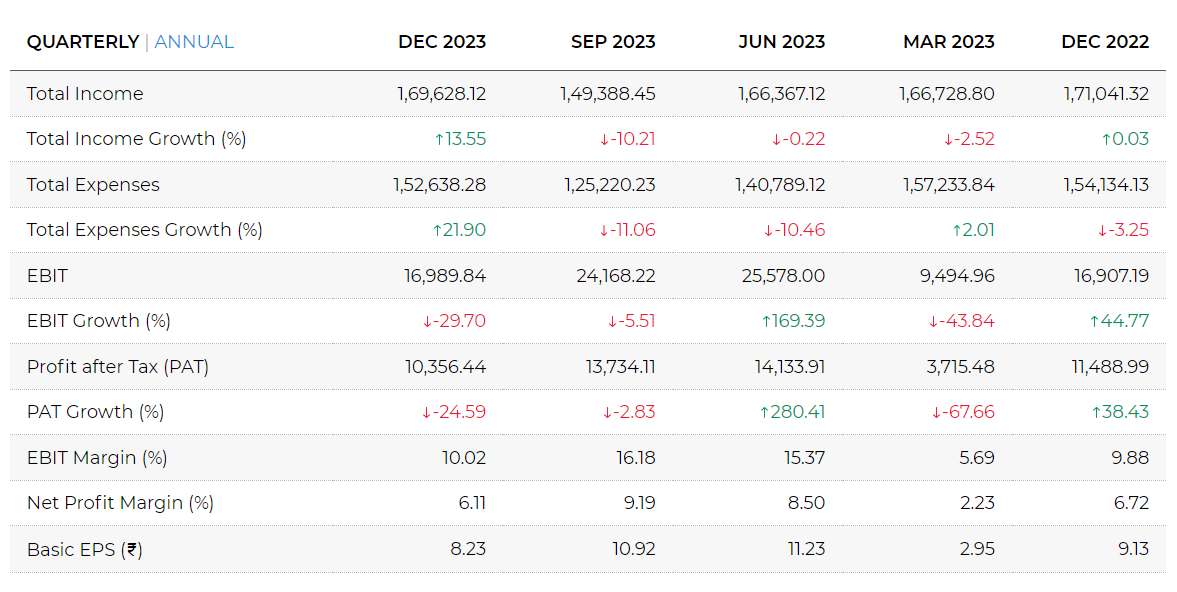
ONGC Financials
Income (P&L)
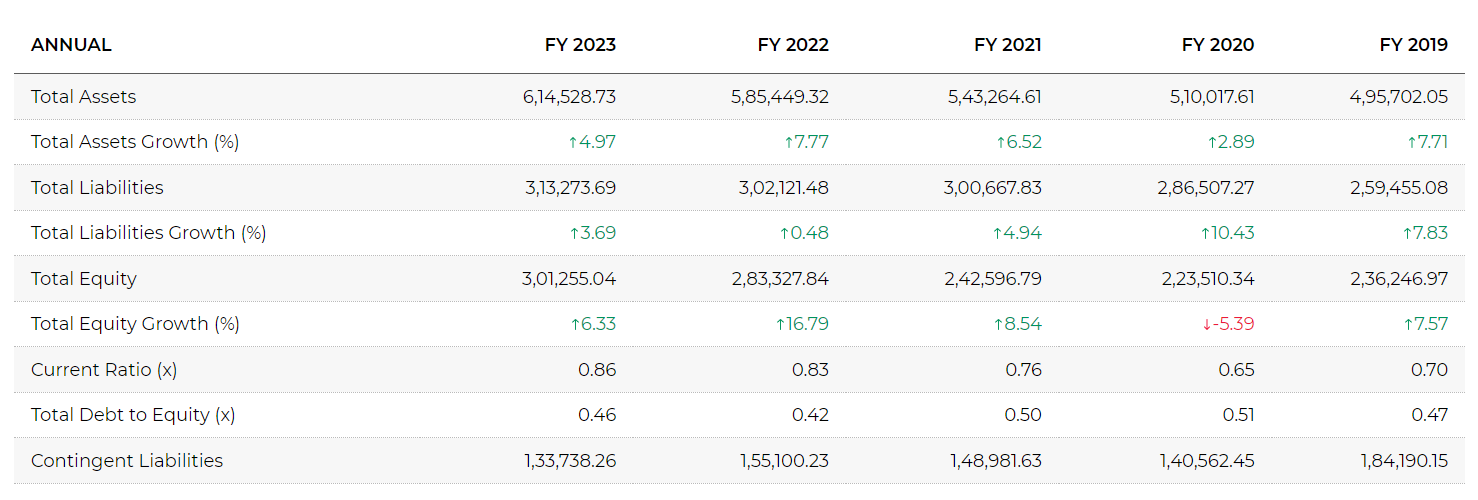
Balance Sheet
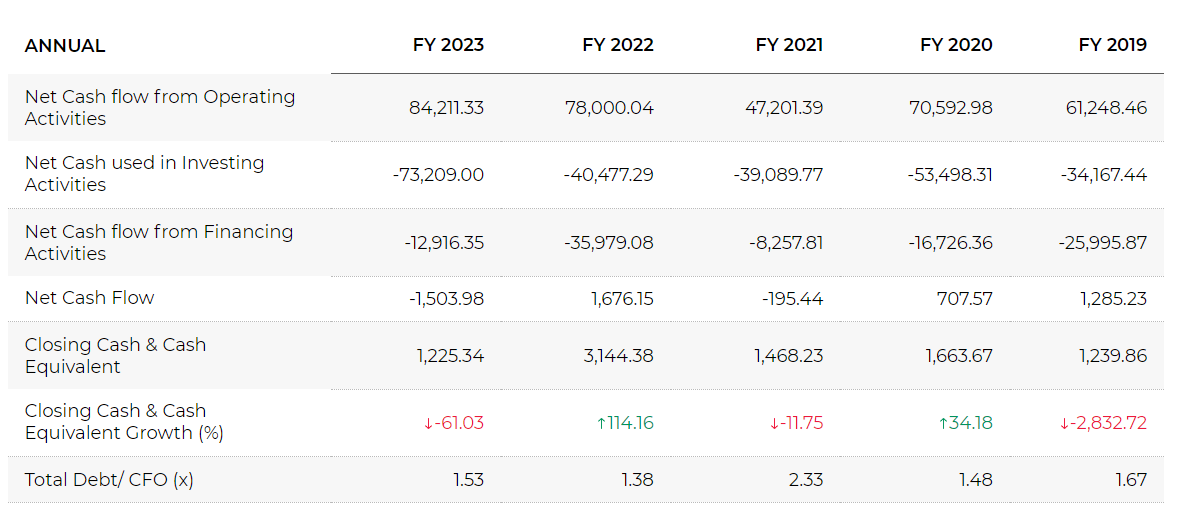
Cash Flow
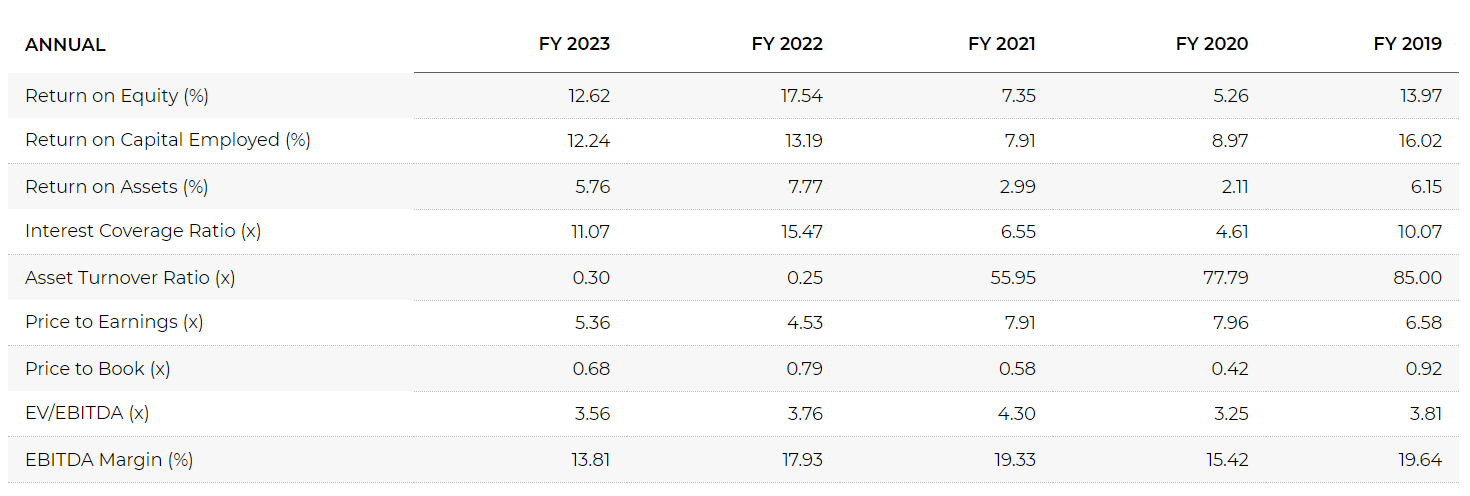
Ratios
ONGC Technicals
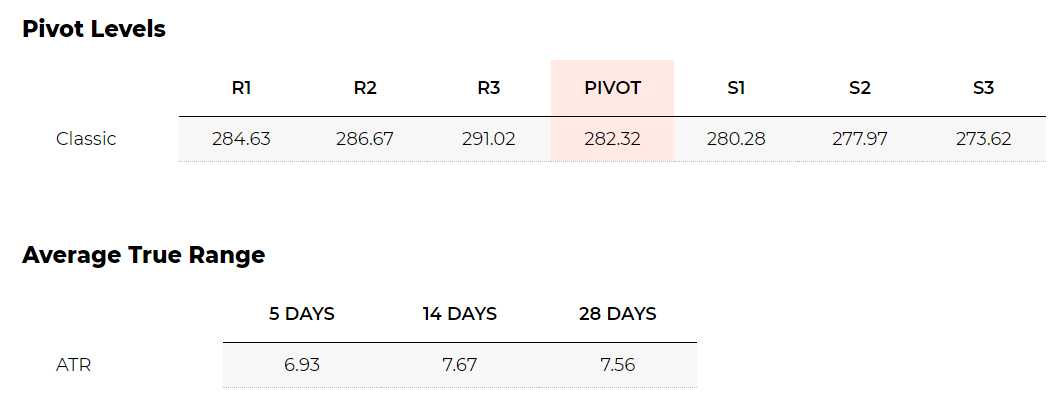
Pivot Levels & Average True Range
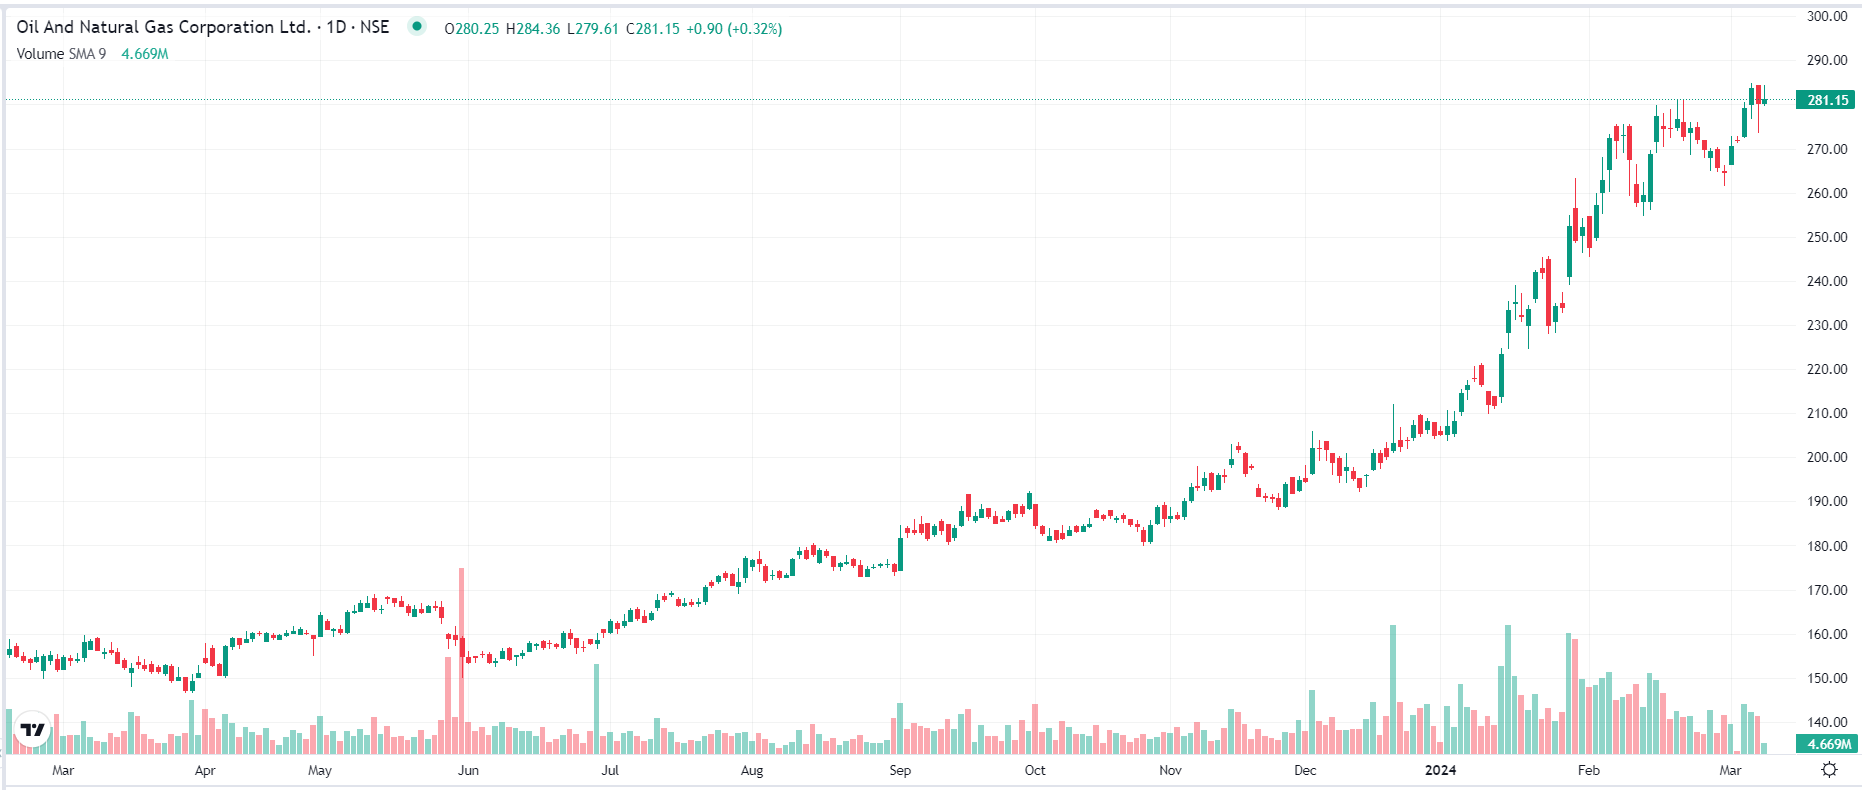
Chart
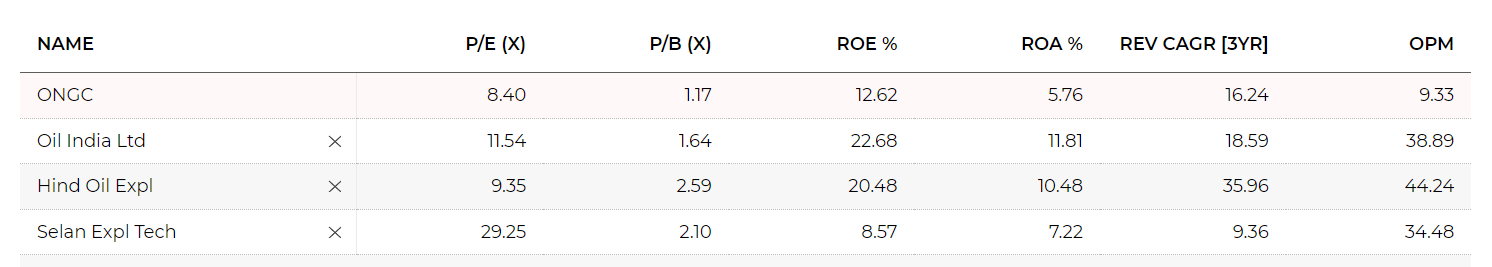
ONGC Peer Comparison
STOCK PERFORMANCE
RATIO PERFORMANCE
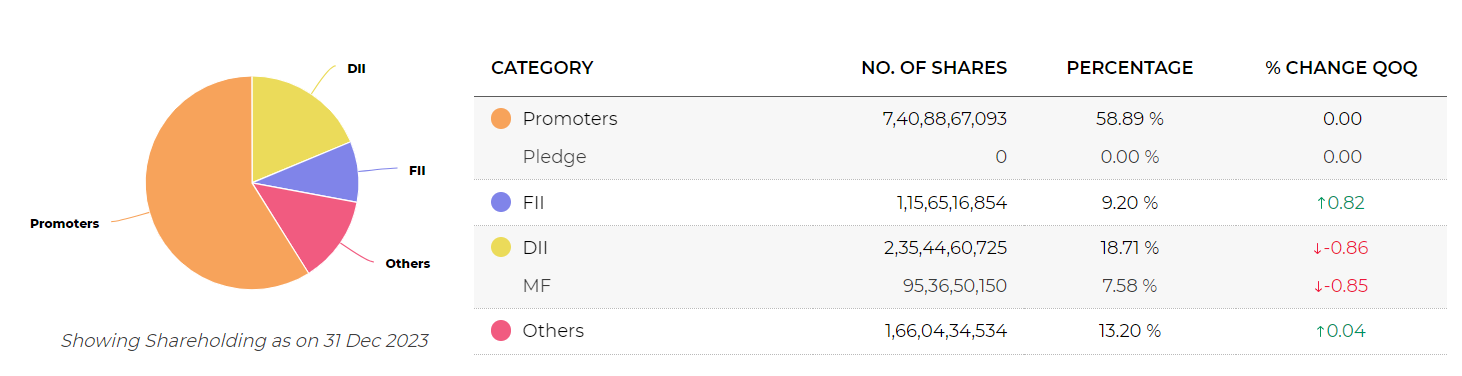
ONGC Shareholding Pattern
QOQ Change

Total Shareholding
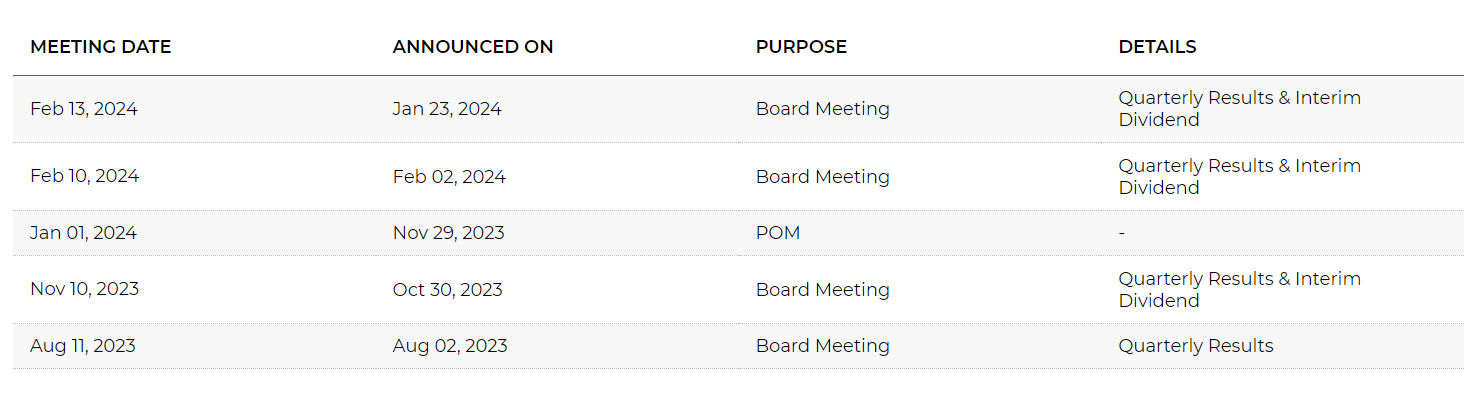
ONGC Corporate Actions
BOARD MEETING/AGM
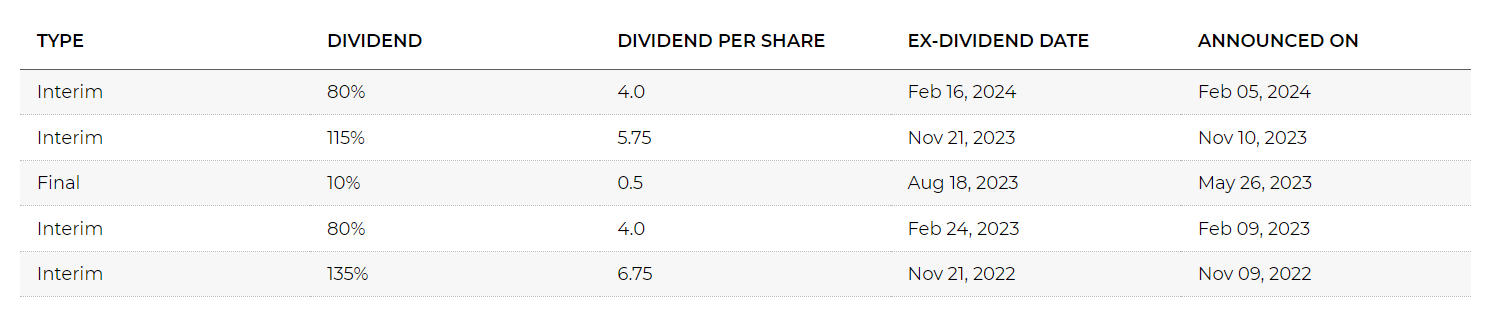
DIVIDENDS
About ONGC
Oil And Natural Gas Corporation Ltd., incorporated in the year 1993, is a Large Cap company (having a market cap of Rs 352,562.32 Crore) operating in Gas & Petroleum sector.
Oil And Natural Gas Corporation Ltd. key Products/Revenue Segments include Oil Crude, Gas Natural, Naphtha, Ethane, Propane, C2/C3 (Ethane/Propane), Butane, Subsidy, Aviation Turbine Fuel (ATF), Other Operating Revenue, HSD, LSHS, Electricity, Processing Charges, Mineral Turpentine Oil (MTO), Superior Kerosene Oil for the year ending 31-Mar-2023.
For the quarter ended 31-12-2023, the company has reported a Consolidated Total Income of Rs 169,628.12 Crore, up 13.55 % from last quarter Total Income of Rs 149,388.45 Crore and down .83 % from last year same quarter Total Income of Rs 171,041.32 Crore. Company has reported net profit after tax of Rs 10,677.80 Crore in latest quarter.
The company’s top management includes Mr.Arun Kumar Singh, Mr.Praveen Mal Khanooja, Dr.Madhav Singh, Mr.Manish Pareek, Dr.Prabhaskar Rai, Mrs.Reena Jaitly, Mr.Syamchand Ghosh, Mr.V Ajit Kumar Raju, Mr.Manish Patil, Mr.Om Prakash Singh, Mr.Pankaj Kumar, Mrs.Pomila Jaspal, Ms.Sushma Rawat, Mr.Pomila Jaspal, Mr.Rajni Kant. Company has S Bhandari & Co. as its auditors. As on 31-12-2023, the company has a total of 1,258.03 Crore shares outstanding.