TCS Alpha chart
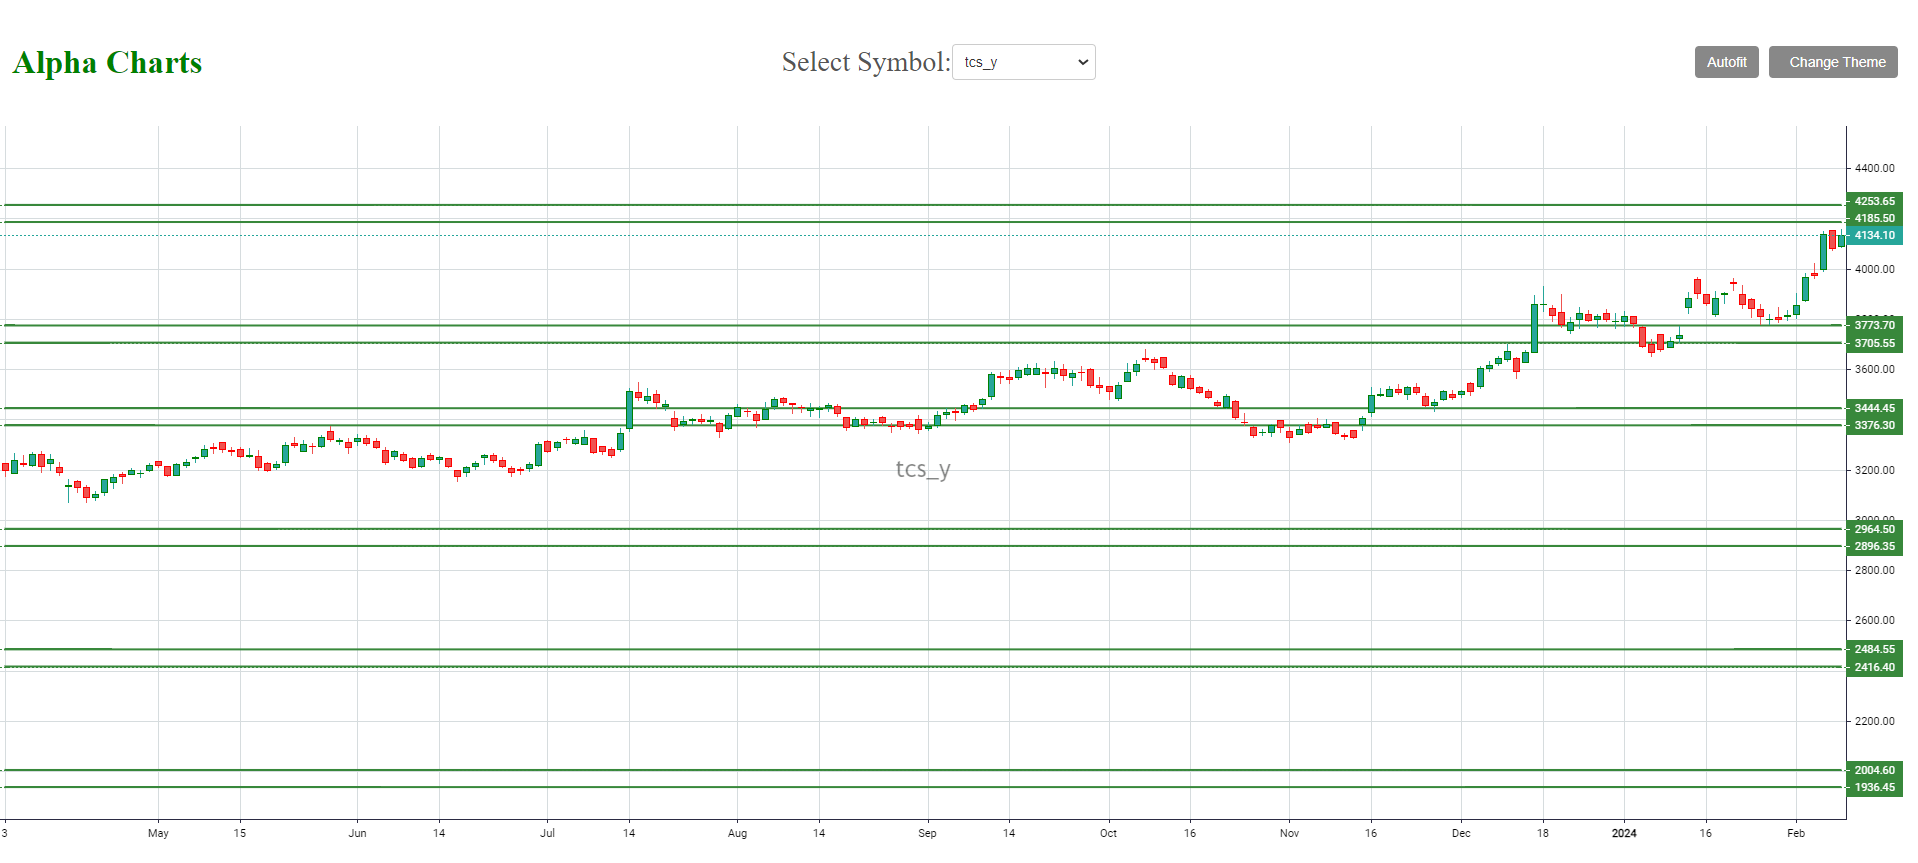
Welcome to the Tata Consultancy Services Stock blog, analysis on a top-performing stock. Stay ahead of the market with our in-depth coverage of Tata Consultancy Services, including: Last traded price 4130.0, Market capitalization: 1495608.84, Volume: 8808, Price-to-earnings ratio 33.34, Earnings per share 124.0. Get a complete picture of Tata Consultancy Services’s performance through our comprehensive blend of fundamental and technical indicators. Stay informed about breaking news that can influence the stock’s trajectory. Our blog equips you with the knowledge and insights needed to make confident investment decisions. Don’t miss out on the latest updates as Tata Consultancy Services continues to make waves in the market. The data points are updated as on 12-02-2024 09:10 IST
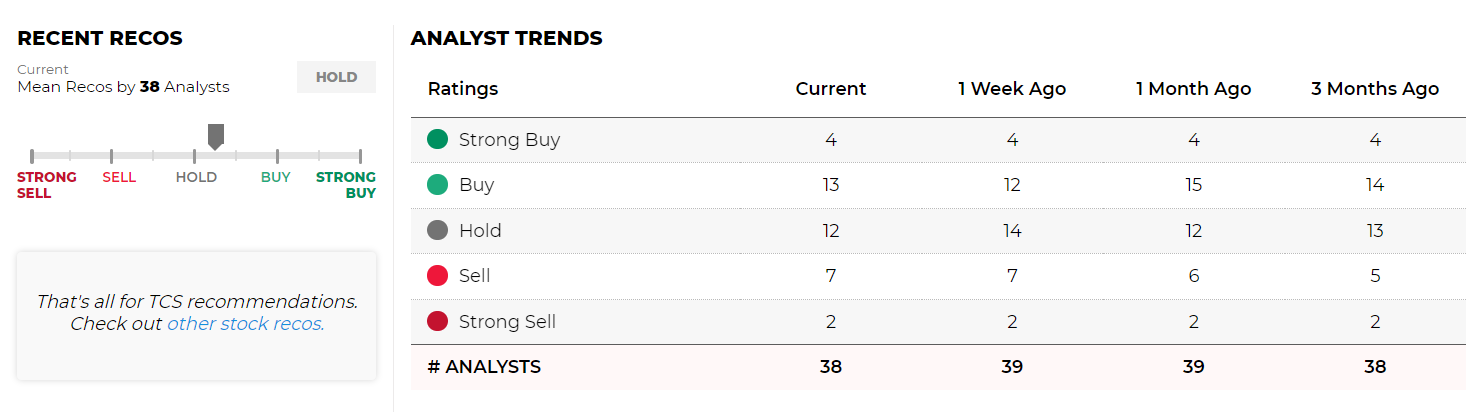
TCS Share Recommendations
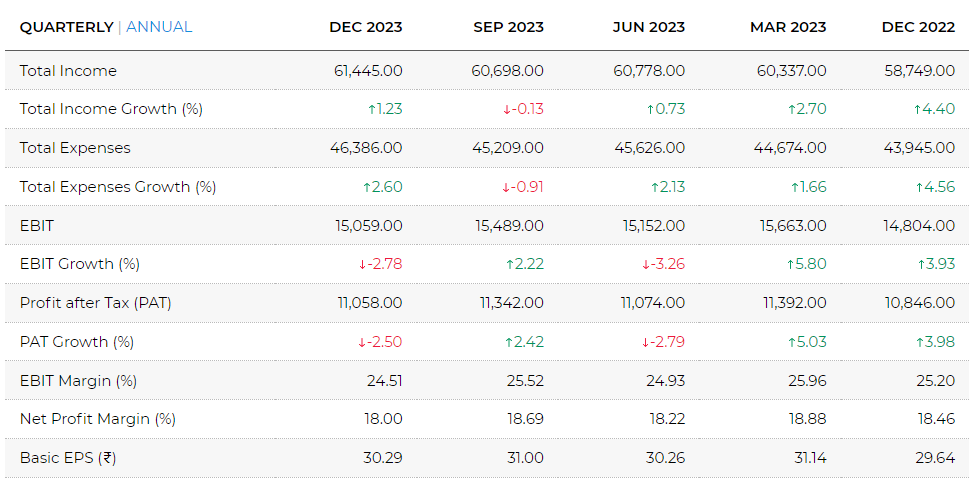
TCS Financials
Income (P&L)
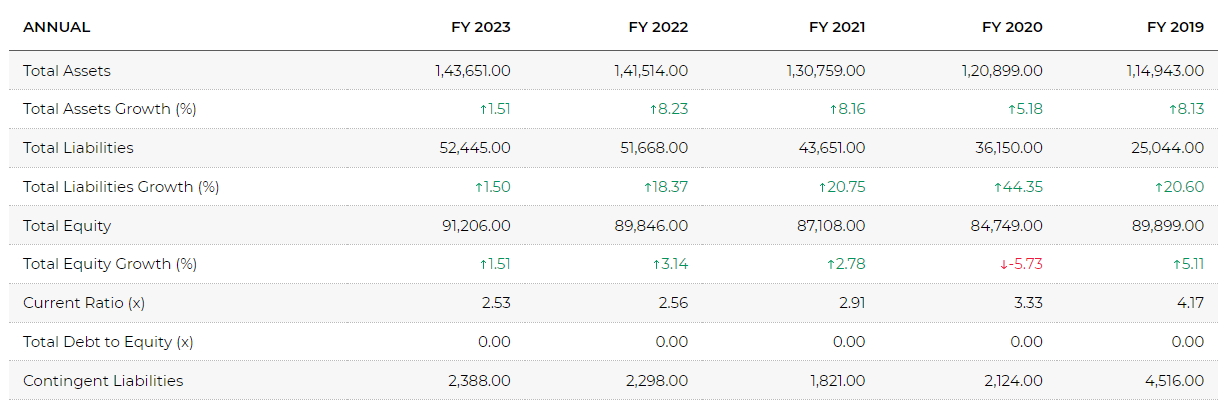
Balance Sheet
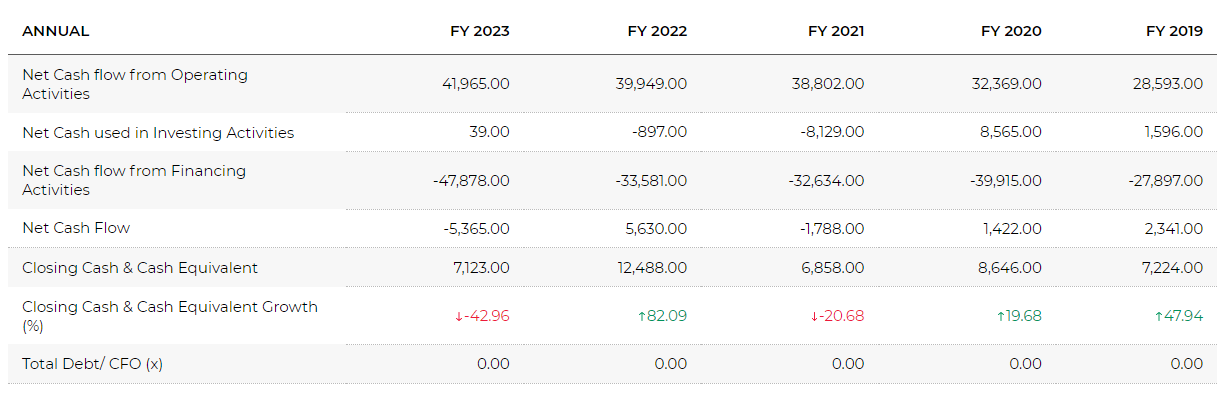
Cash Flow
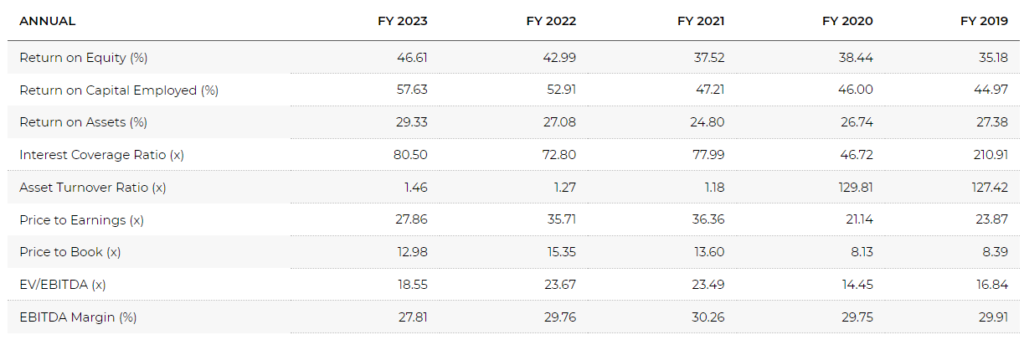
Ratios
TCS Technicals
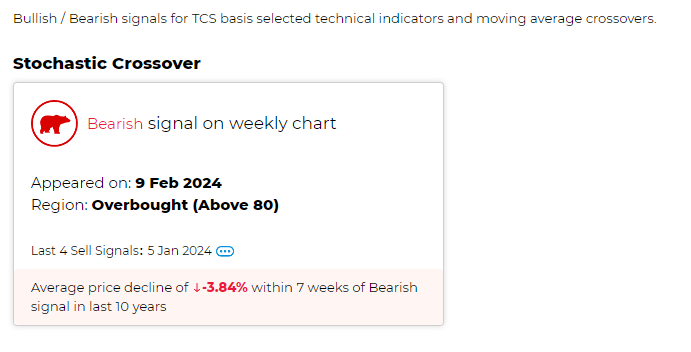
Buy/Sell Signals
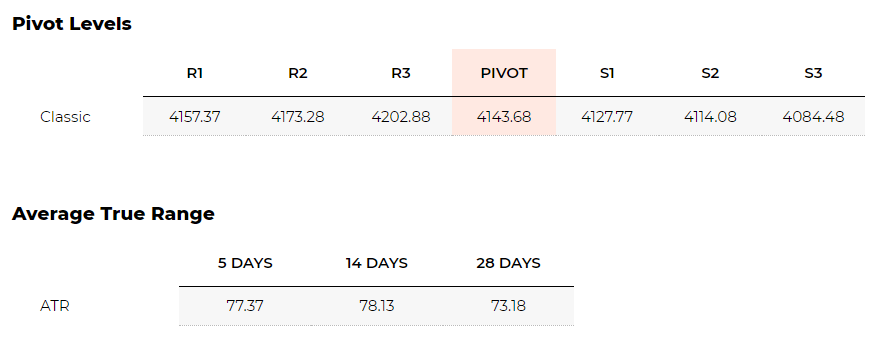
Pivot Levels & Average True Range
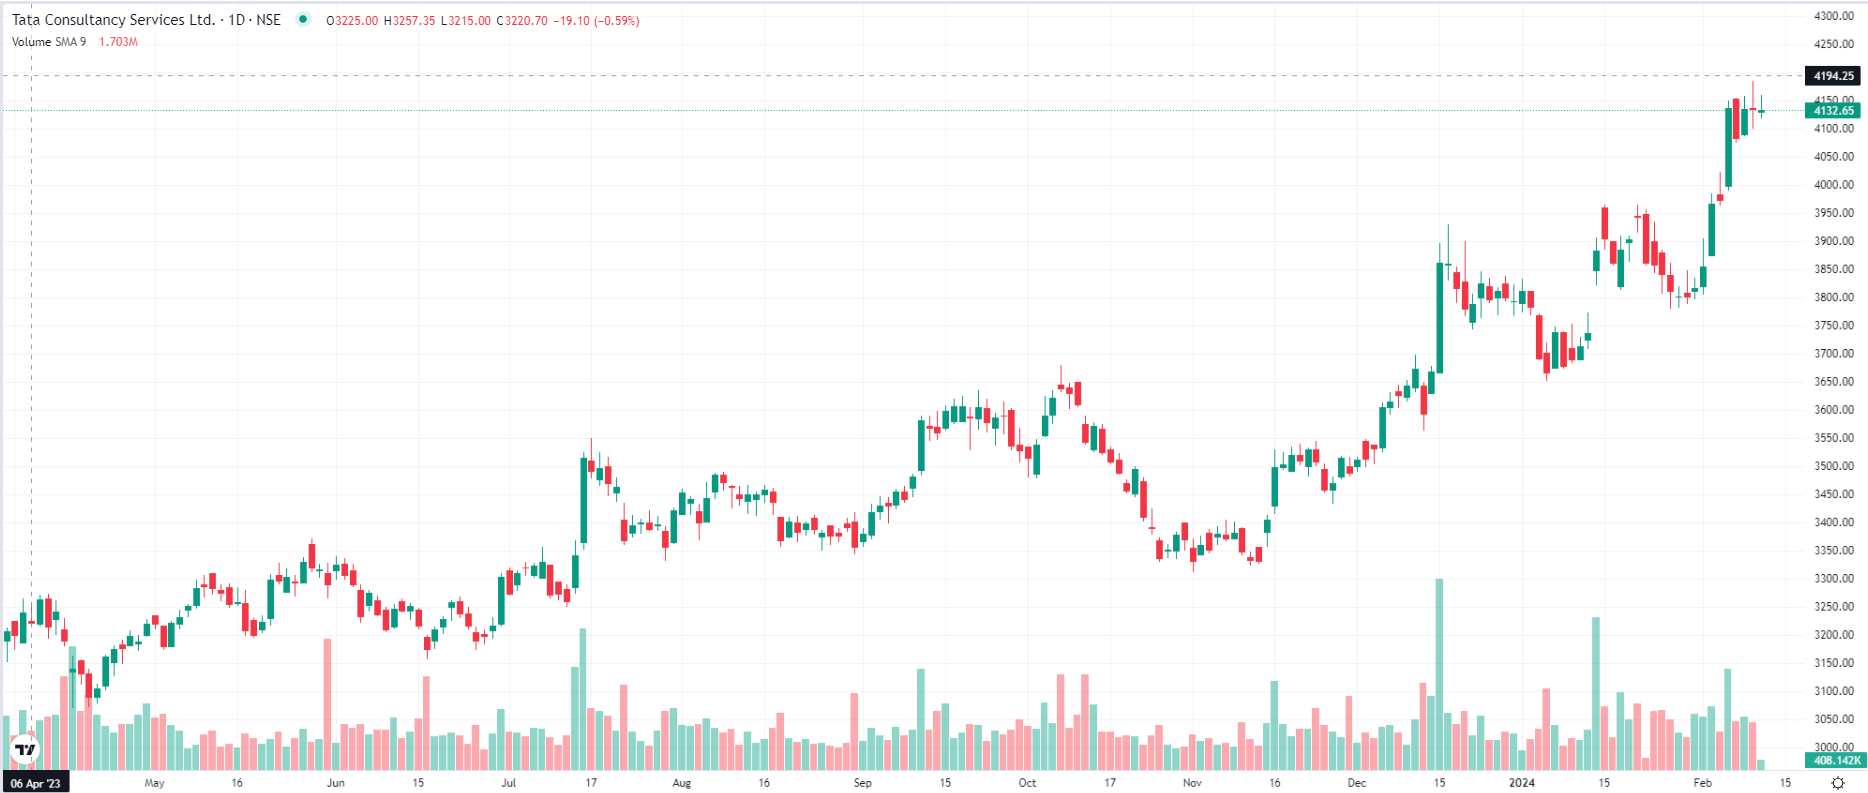
Chart
TCS Peer Comparison
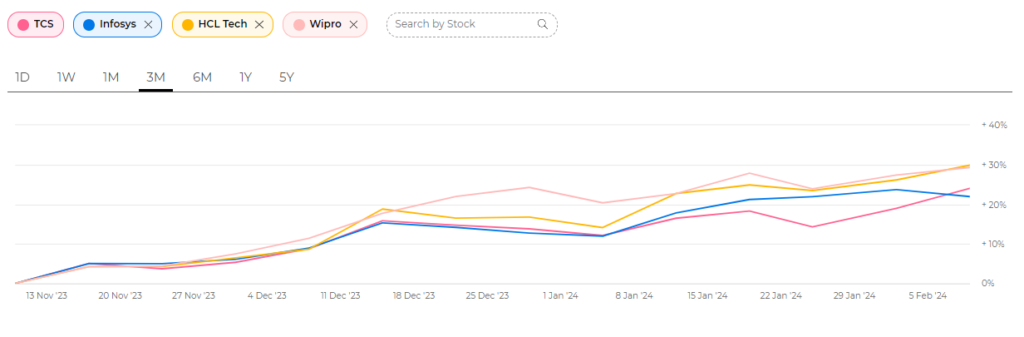
STOCK PERFORMANCE
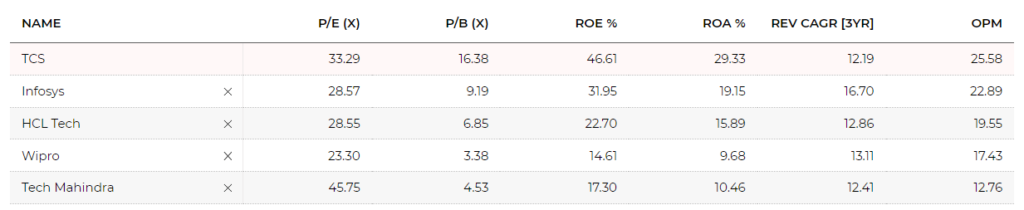
RATIO PERFORMANCE
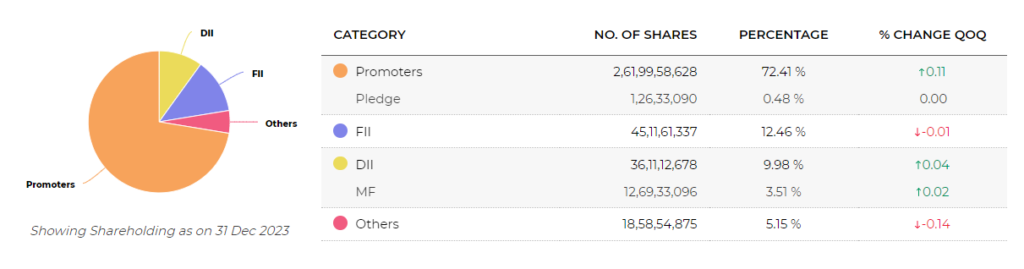
TCS Shareholding Pattern
QOQ Change
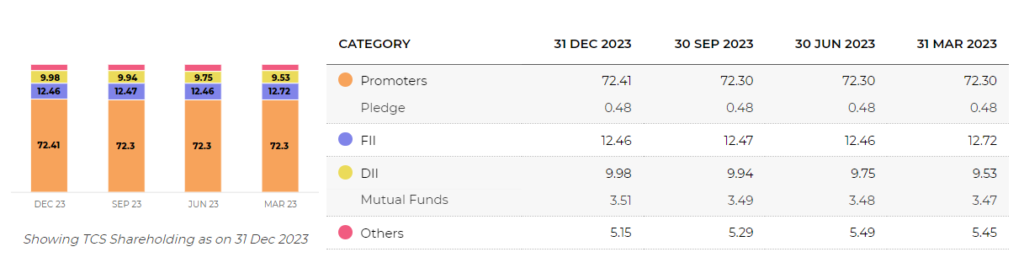
Total Shareholding
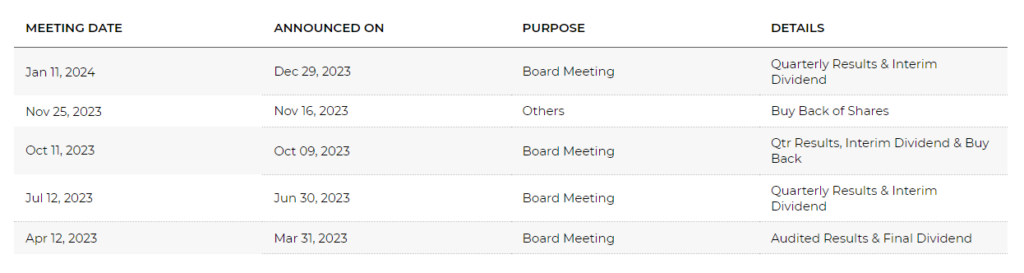
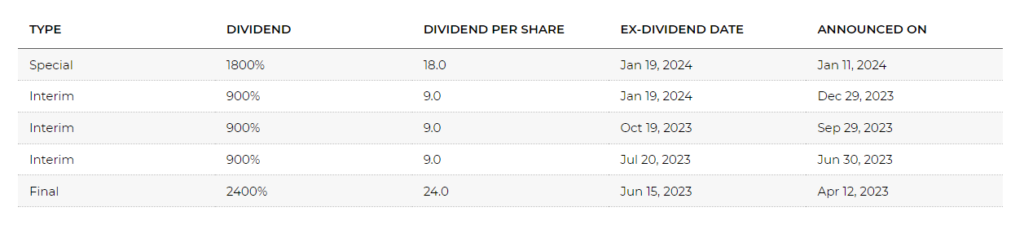
TCS Corporate Actions
BOARD MEETING/AGM
DIVIDENDS
About TCS
Tata Consultancy Services Ltd., incorporated in the year 1995, is a Large Cap company (having a market cap of Rs 1,495,608.84 Crore) operating in IT Software sector.
Tata Consultancy Services Ltd. key Products/Revenue Segments include Consultancy Income and Sale of Equipment & Software Licences for the year ending 31-Mar-2023.
For the quarter ended 31-12-2023, the company has reported a Consolidated Total Income of Rs 61,445.00 Crore, up 1.23 % from last quarter Total Income of Rs 60,698.00 Crore and up 4.59 % from last year same quarter Total Income of Rs 58,749.00 Crore. Company has reported net profit after tax of Rs 11,097.00 Crore in latest quarter.
The company’s top management includes Mr.N Chandrasekaran, Mr.K Krithivasan, Mr.N G Subramaniam, Ms.Aarthi Subramanian, Mr.Don Callahan, Ms.Hanne Sorensen, Mr.Keki M Mistry, Mr.O P Bhatt, Dr.Pradeep Kumar Khosla, Mr.Samir Seksaria, Mr.Pradeep Manohar Gaitonde. Company has B S R & Co. LLP as its auditors. As on 31-12-2023, the company has a total of 361.81 Crore shares outstanding.