Titan Alpha chart

Titan Company Stock Blog, your go-to platform for real-time updates and analysis on a top-performing stock. Stay ahead of the market with our in-depth coverage of Titan Company, including: Last traded price 3690.0, Market capitalization: 327766.21, Volume: 1611, Price-to-earnings ratio 94.98, Earnings per share 38.87. Get a complete picture of Titan Company’s performance through our comprehensive blend of fundamental and technical indicators. Stay informed about breaking news that can influence the stock’s trajectory. Our blog equips you with the knowledge and insights needed to make confident investment decisions. Don’t miss out on the latest updates as Titan Company continues to make waves in the market. The data points are updated as on 26-02-2024.
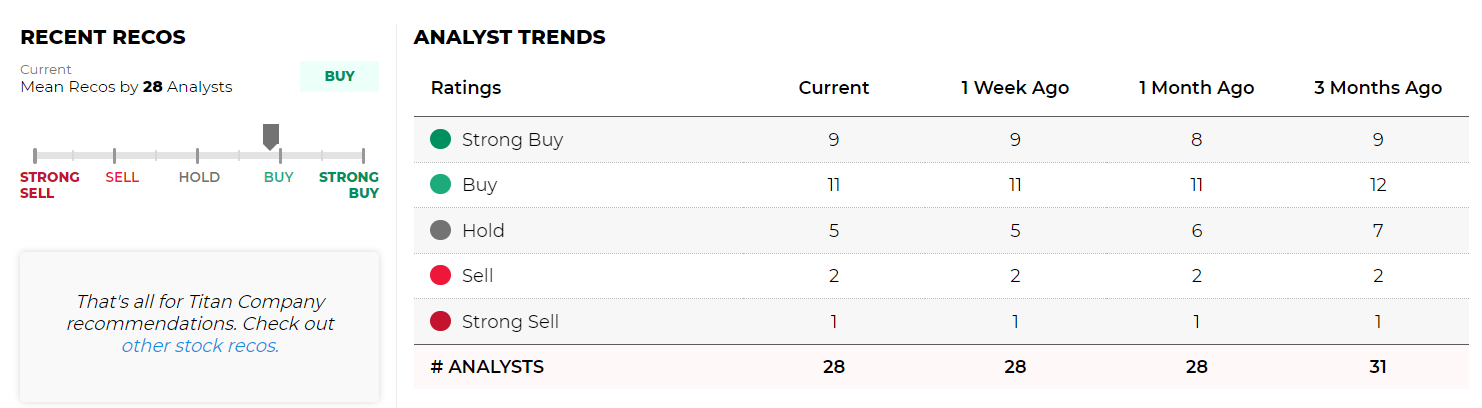
Titan Share Recommendations
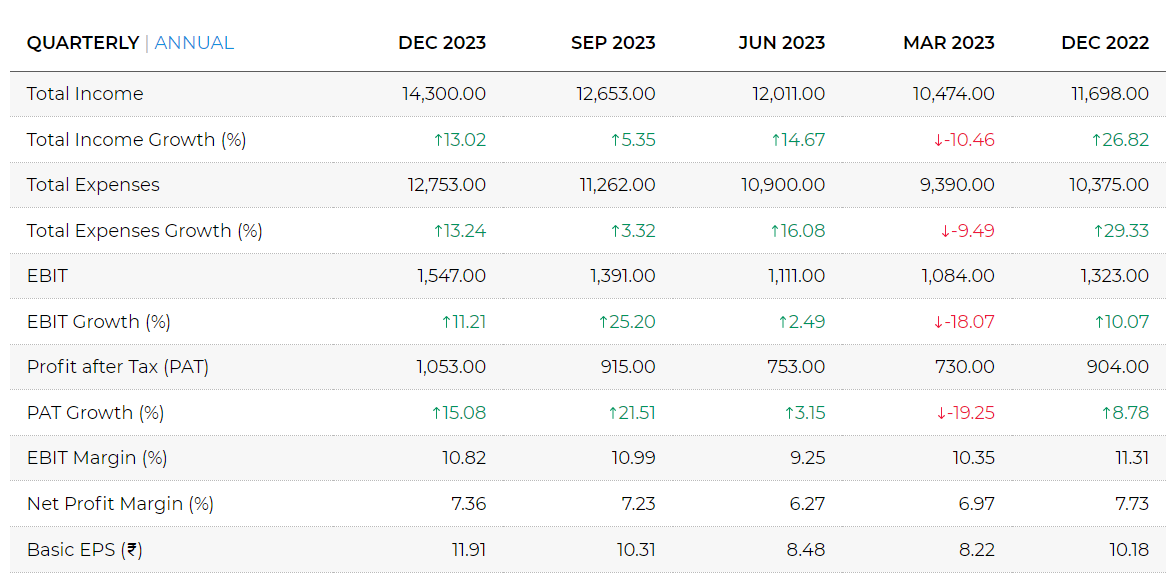
Titan Financials
Income (P&L)
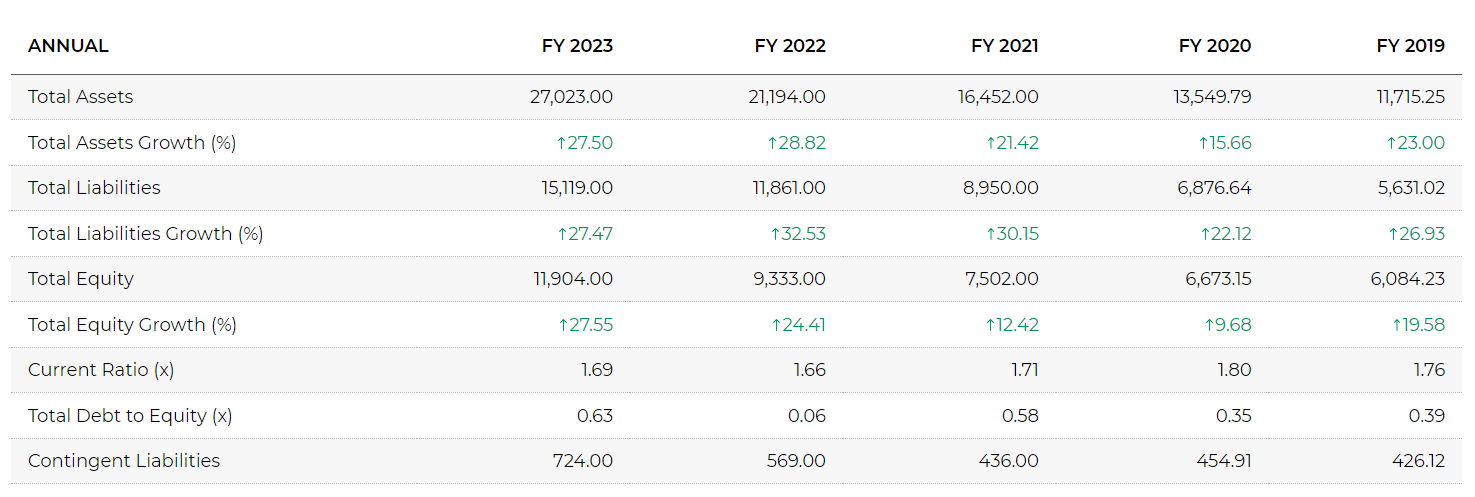
Balance Sheet
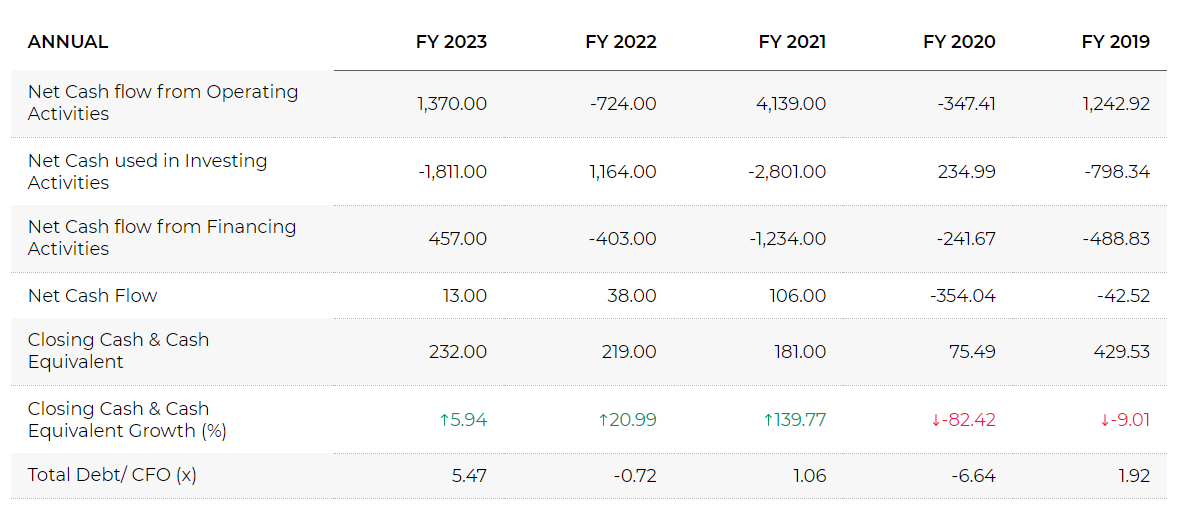
Cash Flow
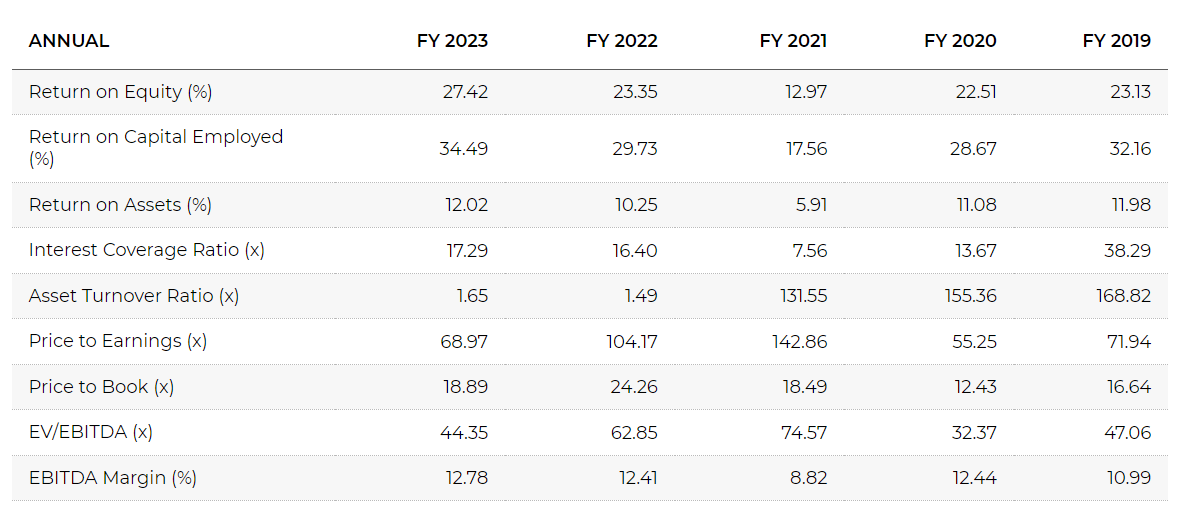
Ratios
Titan Technicals
Buy / Sell Signals

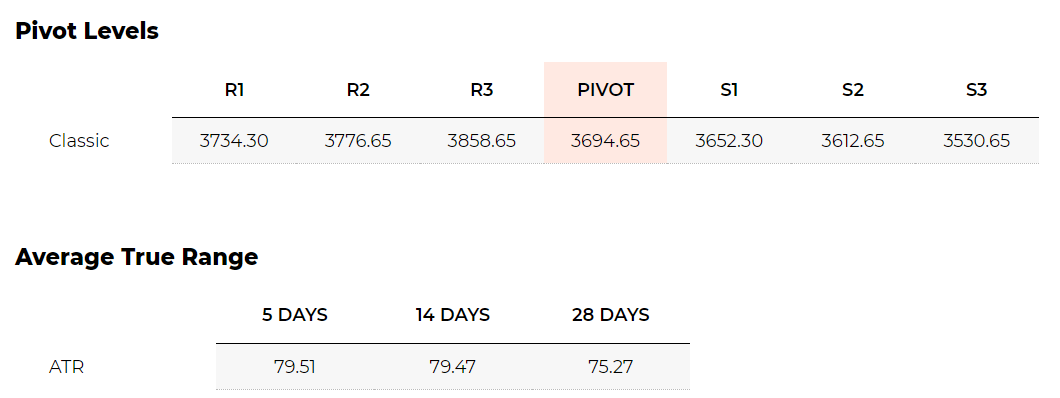
Pivot Levels & Average True Range
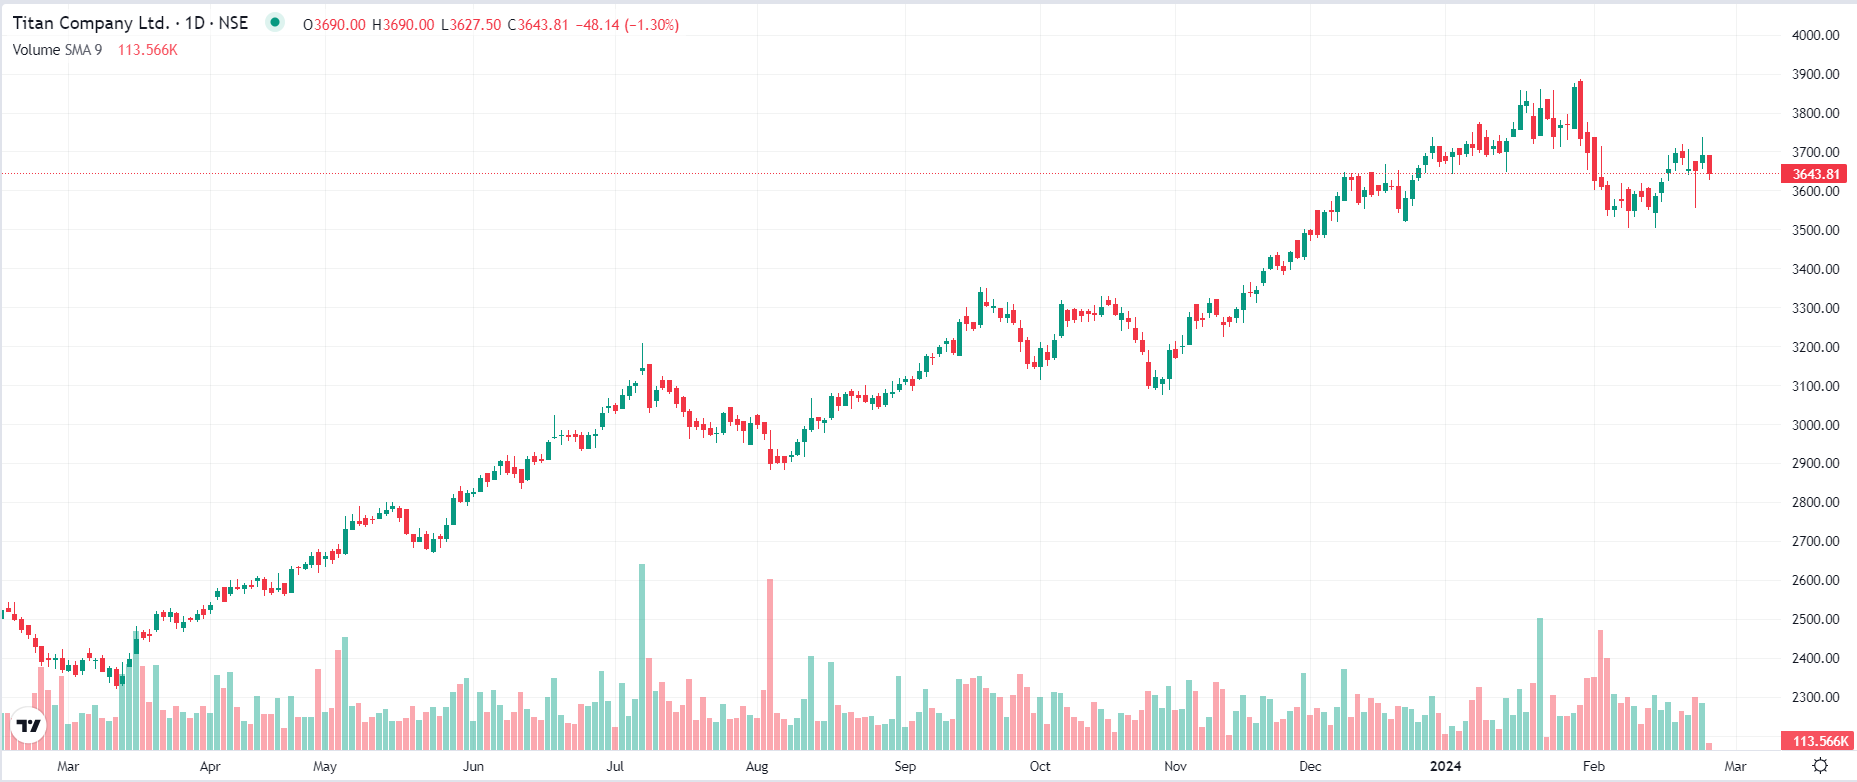
Chart
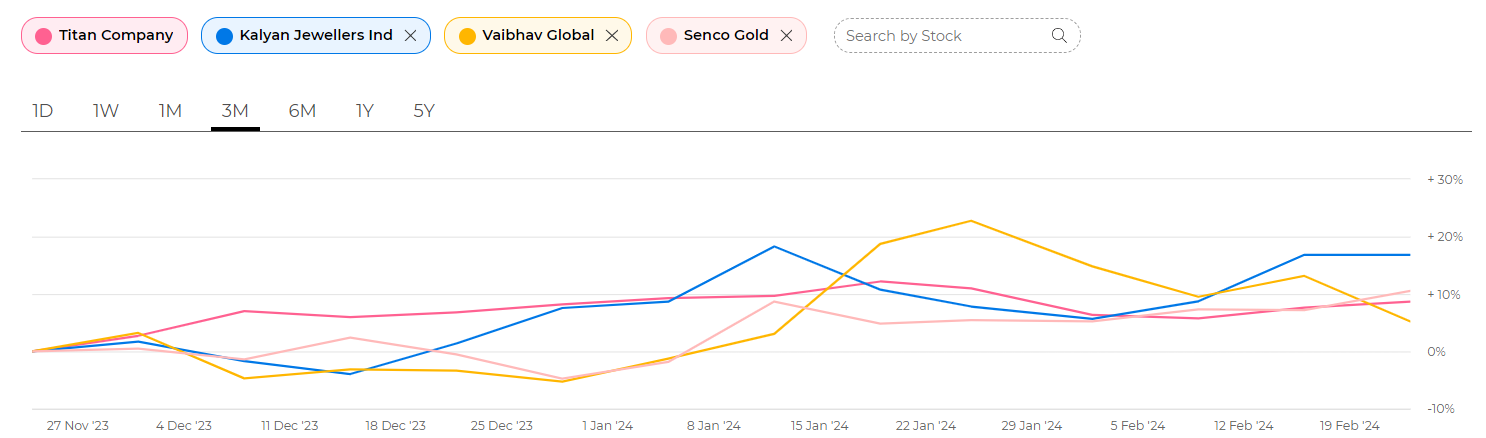
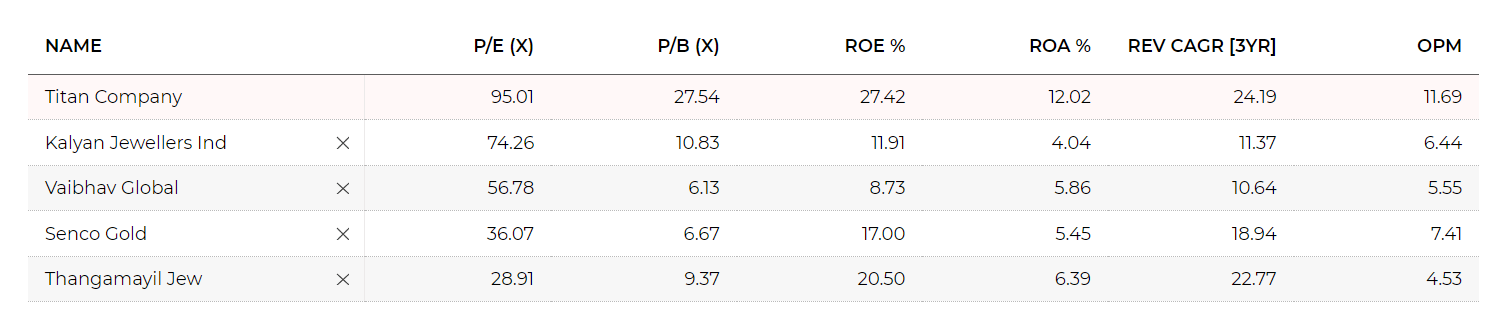
Titan Peer Comparison
STOCK PERFORMANCE
RATIO PERFORMANCE
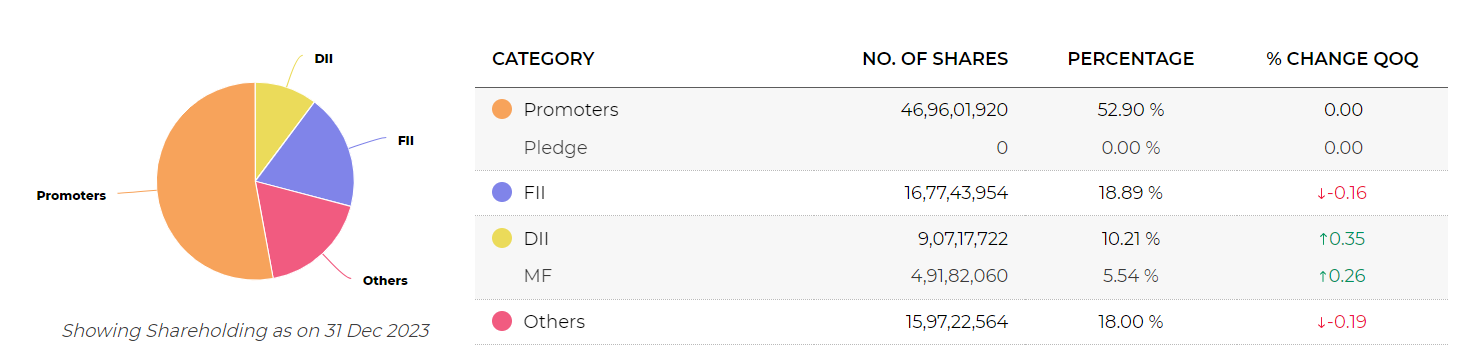
Titan Shareholding Pattern
QOQ Change

Total Shareholding
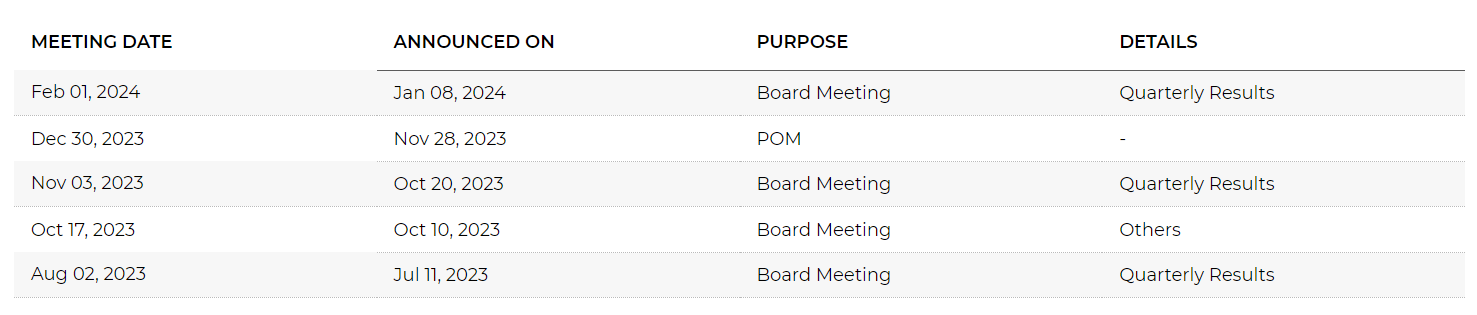
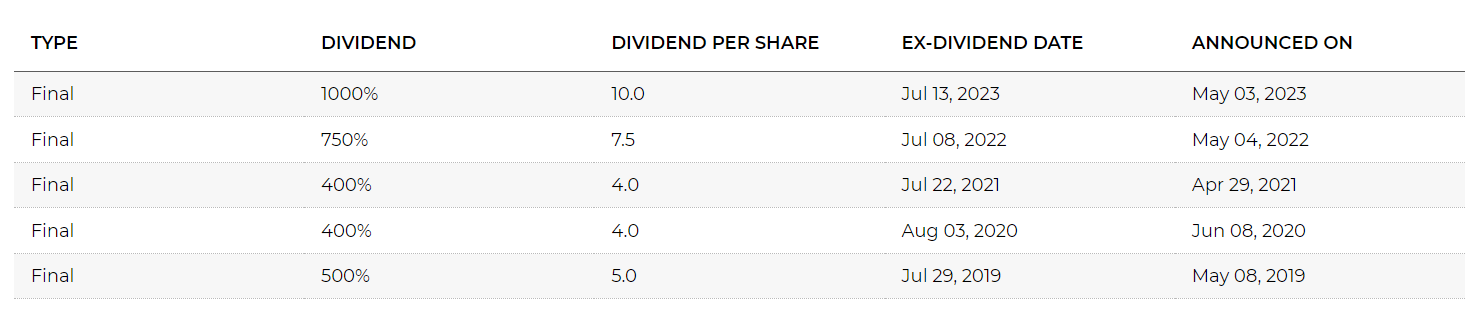
Titan Corporate Actions
BOARD MEETING/AGM
DIVIDENDS
About Titan
Titan Company Ltd., incorporated in the year 1984, is a Large Cap company (having a market cap of Rs 327,766.21 Crore) operating in Gems and Jewellery sector.
Titan Company Ltd. key Products/Revenue Segments include Jewellery, Watches, Other Operating Revenue, Eyewear, Others, Precious & Semi Precious Stones, Scrap, Other Services for the year ending 31-Mar-2023.
For the quarter ended 31-12-2023, the company has reported a Consolidated Total Income of Rs 14,300.00 Crore, up 13.02 % from last quarter Total Income of Rs 12,653.00 Crore and up 22.24 % from last year same quarter Total Income of Rs 11,698.00 Crore. Company has reported net profit after tax of Rs 1,053.00 Crore in latest quarter.
The company’s top management includes Mr.S Krishnan, Mr.N N Tata, Mr.C K Venkataraman, Mr.Ashwani Puri, Mr.B Santhanam, Dr.Mohanasankar Sivapraksam, Mr.Pradyumna Vyas, Mr.Sandeep Singhal, Ms.Sindhu Gangadharan, Mr.Bhaskar Bhat, Ms.Jayashree Muralidharan, Ms.Mariam Pallavi Baldev, Mr.Ashok Sonthalia, Mr.Dinesh Shetty. Company has B S R & Co. LLP as its auditors. As on 31-12-2023, the company has a total of 88.78 Crore shares outstanding.